Technical Edge —
NYSE Breadth: 50% Upside Volume — chop
Advance/Decline: 43% Advance
VIX: ~$21.50
Individual trades come in waves when the environment is optimal and the R/R skews in our favor. For years, there would be individual trades for months on end. But in a bear market, they come in short 4-6 week bursts, then require patience for things to reset.
The “reset period” is where many traders tend to give back their gains.
Is it “boring” to wait? Yes, but it’s also what the environment calls for and we must always respect the environment.
Just like in surfing, we cannot control the waves or the ocean. We have to wait for the best setups and then take our shot. We will still fall sometimes, but we will survive. If we were to paddle out everyday regardless of conditions, eventually the monsoon would take us under.
S&P 500 — ES
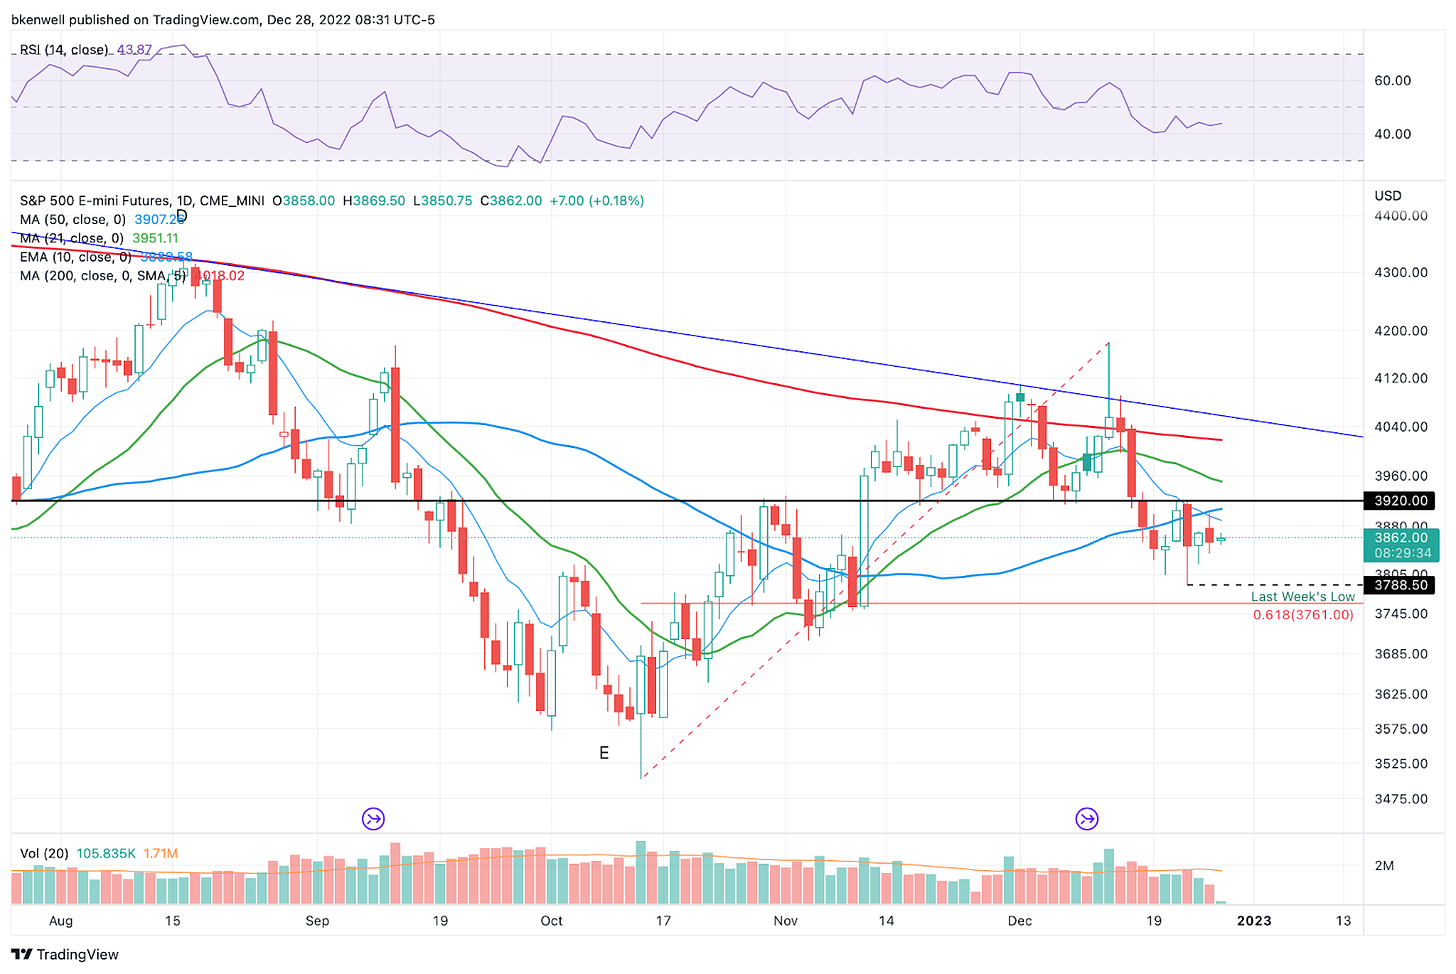
I continue to think of 3900 to 3920 as a brick wall on the upside. If the ES can hurdle it, then there could be some room to run. Until then though, traders have to protect themselves by trading tactically and defensively.
On the downside, a break of 3837 opens the door down to 3788.
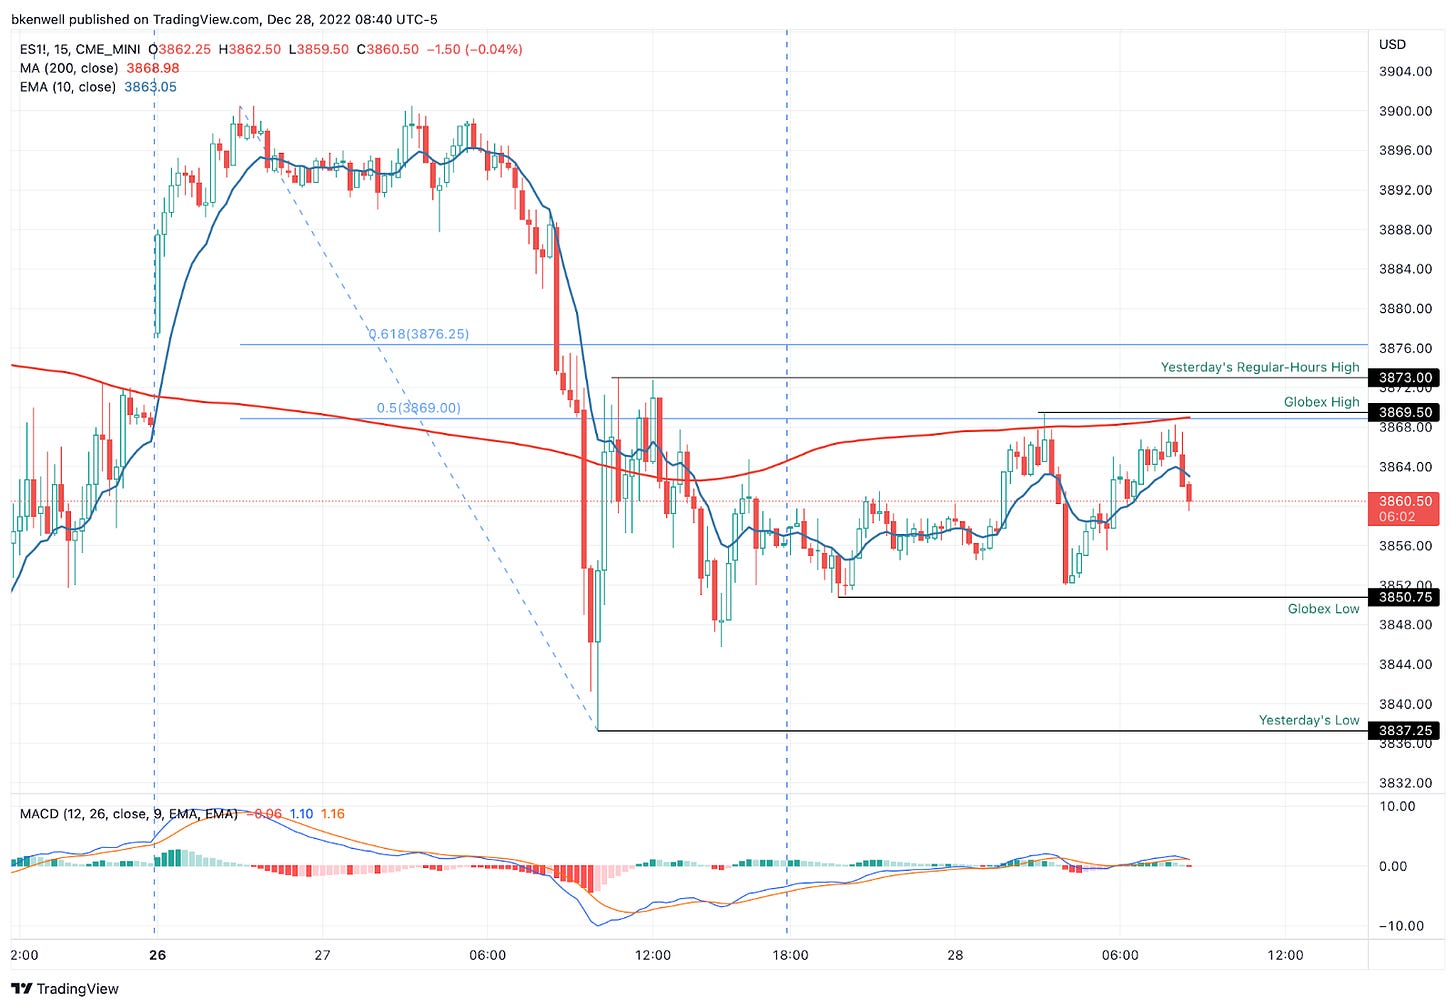
The ES has technically put in four higher lows since yesterday’s low. However, it’s clearly struggling with the 3870 to 3876 area.
For now, we must respect this area as resistance, but if the ES can push through, then that’s what opens the door to 3900-ish.
On the downside, a break of 3850 to 3852 is what puts yesterday’s low back in play at 3937.
SPY
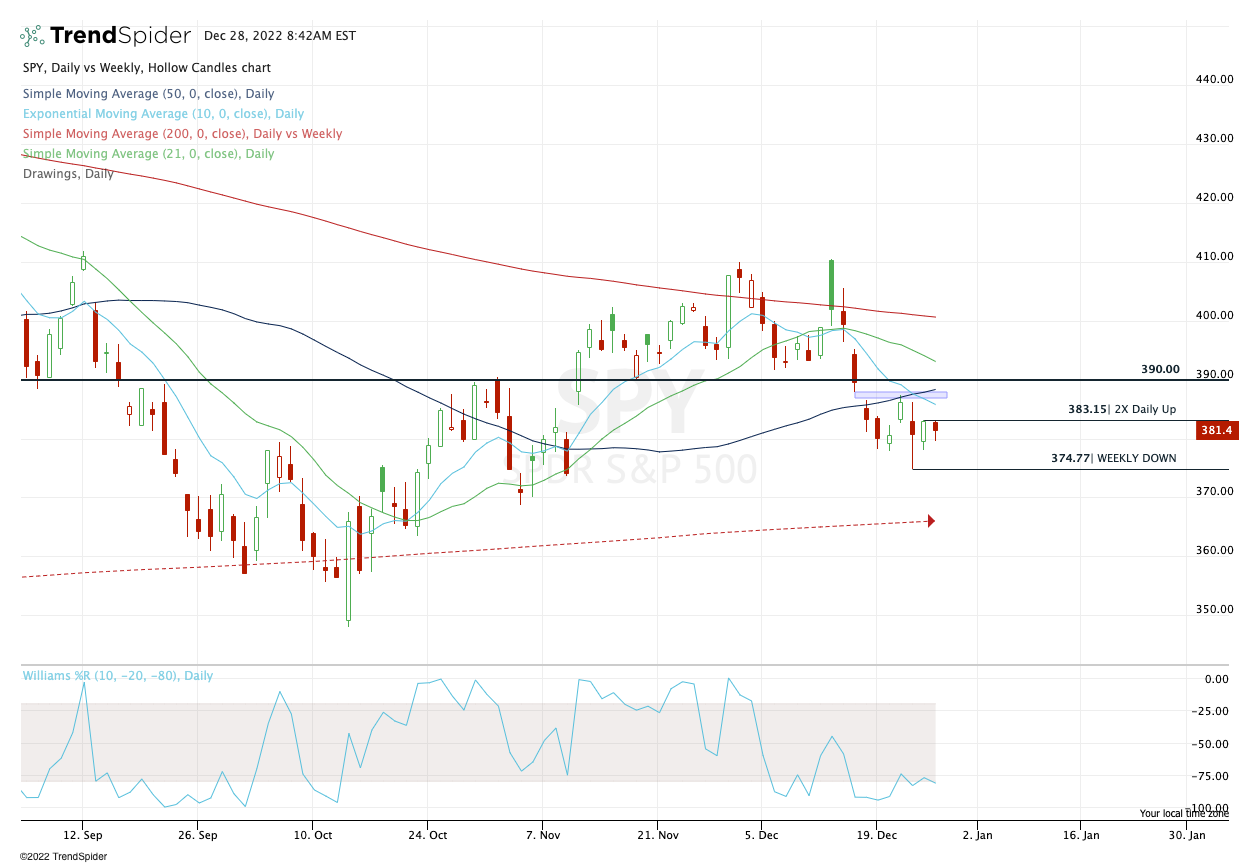
2x daily-up over 383.15 that doesn’t reverse opens the door up to the declining 10-day moving average, which the SPY hasn’t actually touched since Dec. 14 (while the ES has been rejected from this measure twice in three sessions).
Above that could put the $386.50 to $388 area in play, but again, until it can regain $390 it’s hard to trust the rallies.
On the downside, a break of $379.65 puts $378 in play, then last week’s low near $375.
QQQ
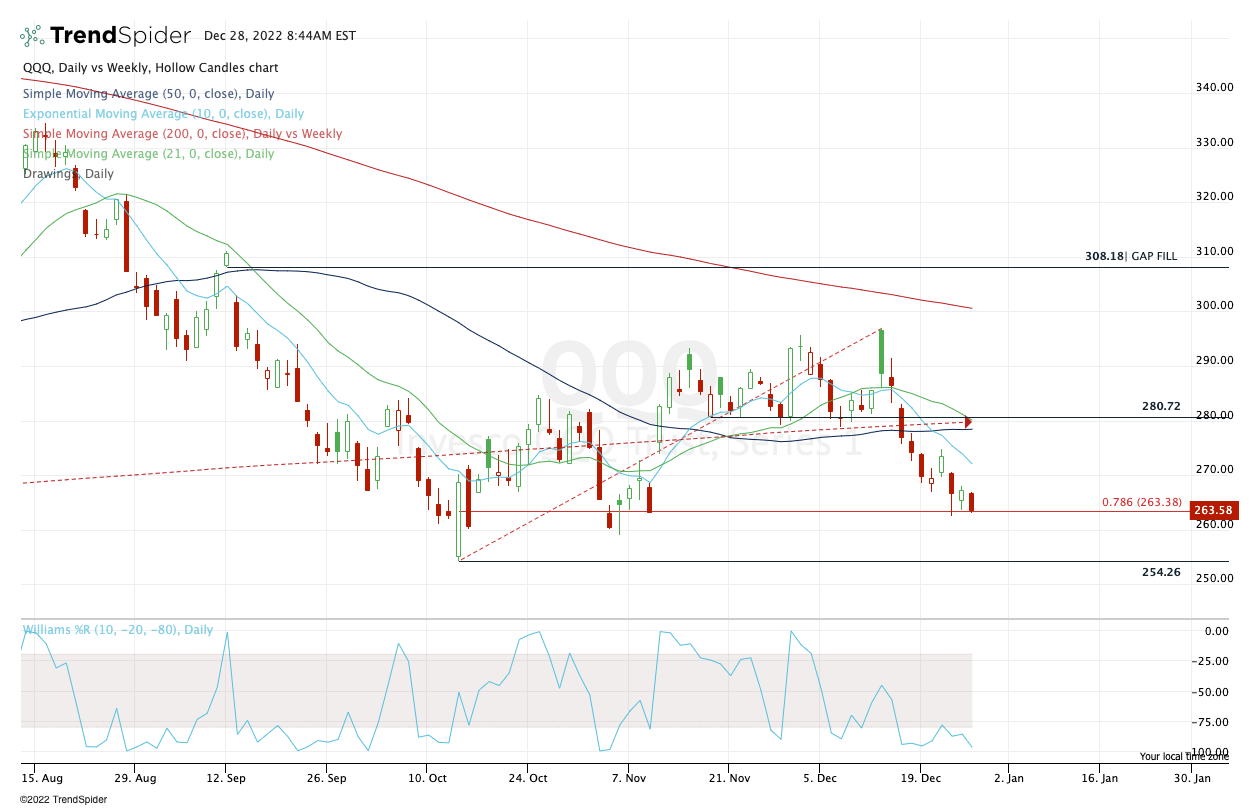
We may eventually get a quick, heated rally in the Qs, but even then it’s likely just a rally to sell until it can regain some other levels of significance.
A break of $262.50 opens the door to $259, but a break of $259 puts the 52-week low in play near $254.25.
On the upside, I’m selling the rally if we see the declining 10-day. Above it puts $278.50 to $280.50 in play, which is also a “sell” in my mind.
Open Positions —
Numbered are the trades that are open.
Bold are the trades with recent updates.
Italics show means the trade is closed.
UUP — Ideally needed a close back over last week’s high of $27.95 and we closed AT $27.95. Long against $27.75 is fine with a ¼ to ⅓ trim at $28.15 to $28.25. Ideally looking for $28.40+
LNG — Long from ~$151, now Trimmed ⅓ at $157.50. B/E Stop (but aggressive traders can use $147). I prefer B/E, for what it’s worth. $162 to $163 is the next trim spot, down to ⅓.
TLT — Slow start but we’ll see. I will feel better about TLT if it can clear and hold $101.10.
For now I’m using $98 as my stop. On the upside, can consider a small trim at ~$102, but really I’m fishing for $103.40 and the declining 10-day.
Go-To Watchlist
*Feel free to build your own trades off these relative strength leaders*
Relative strength leaders →
LNG — keep an eye $150
SBUX — nicely weekly-up setup after 10-week ema reset.
DE — gap-fill & 10-week would be attractive for potential longs
HON — weekly
CAH
LMT, RTX, NOC
MET — weekly
GIS
CI
MCD — weekly
ENPH, FSLR, CEG — solar has strength
VRTX, UNH, MRK
XLE — XOM, CVX, COP, BP, EOG, PXD (Weekly Charts)


