Technical Edge
NYSE Breadth: 88% Upside Volume (!)
Advance/Decline: 85% Advance
VIX: ~$17.25
Going to let the charts do the talking this morning. Here’s the S&P & Nasdaq, plus a handful of stocks that have my attention.
S&P 500 — ES
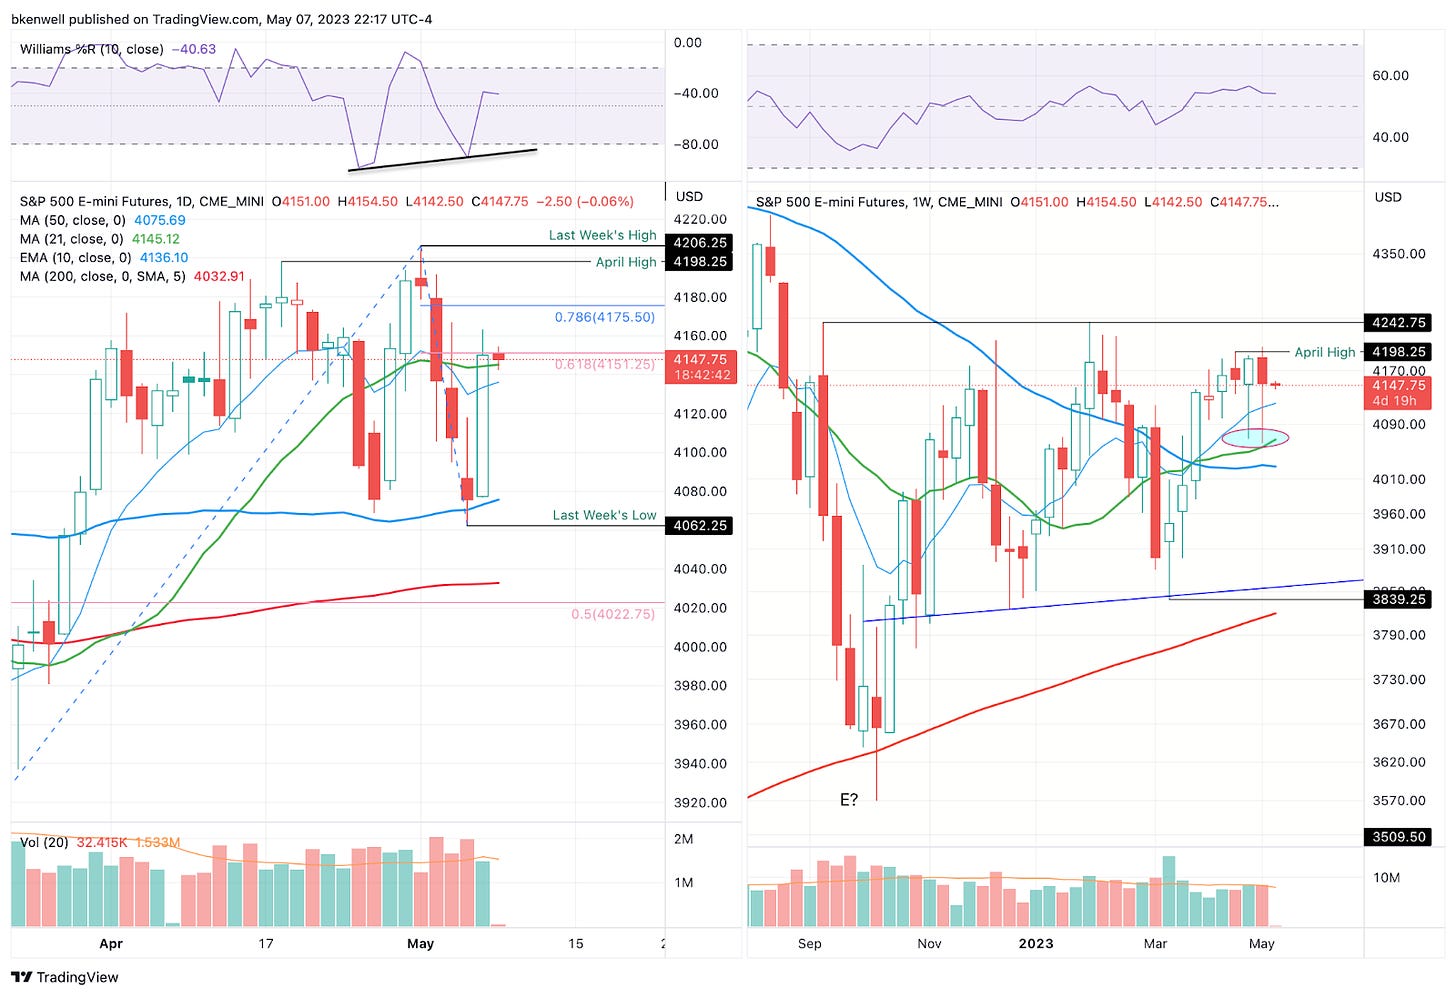
The ES fell four days in a row, but Friday’s big rally erased about 70% of the dip. That said, the ES is struggling with the 61.8% retracement near 4151.
Pivot: 4150
Upside Levels: 4165, 4175-80, 4198-4206
Downside levels: 4112-4120, 4100, 4080
Bigger Picture: Note the weekly chart on the right. Hard to ignore those two huge wicks out of the 4075 area. Bulls still have a big job though, which is clearing 4200 and putting 4242+ in play.
On the downside, a break of 4075 puts 4030 in play, while a close below 4000 could put the big 3800 to 3850 area on the table. That’s been support for the last 5 months and now it lines up with the 200-week moving average as well.
SPY
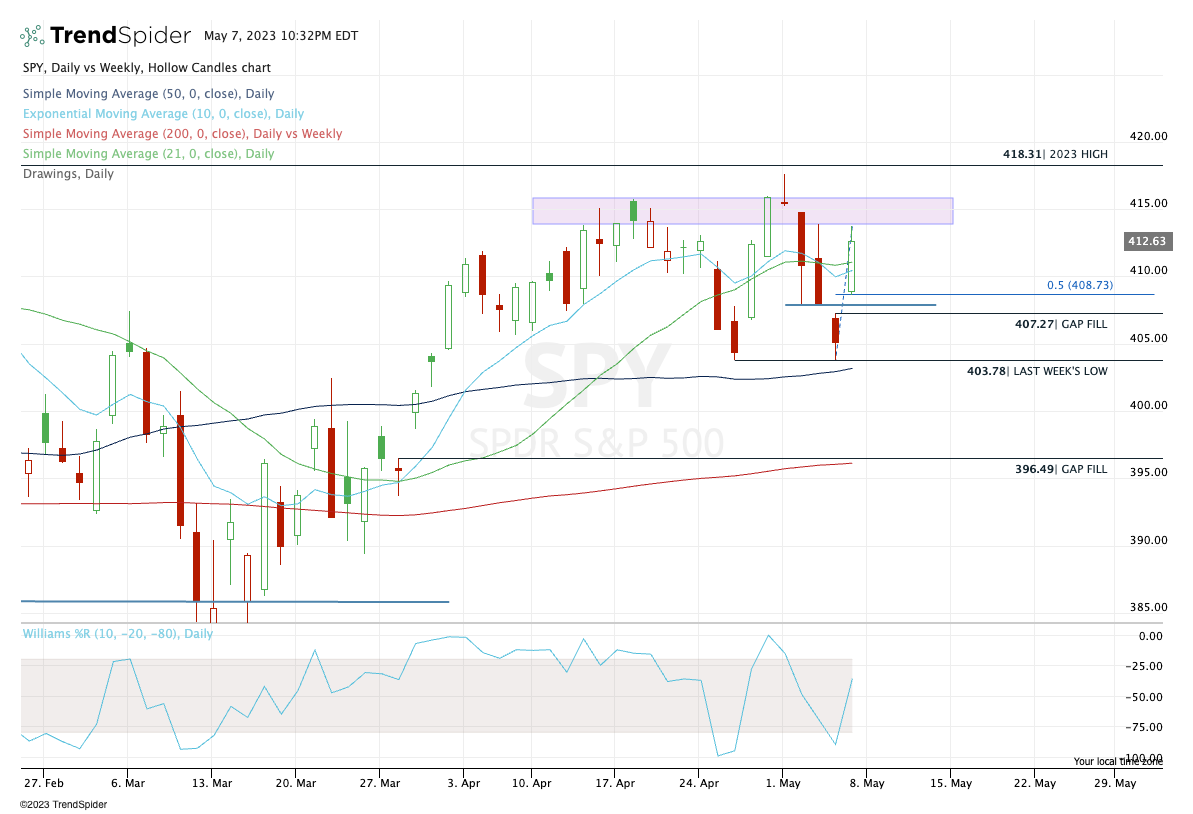
I don’t think we can ignore where resistance came into play, in the $414 to $416. area.
Upside Levels: $414-16, $417.50 to $418.30
Downside Levels: $411, $408.75, $407.27 (gap fill), $405
SPX
Key Pivot: 4150
Upside Levels: 4165-70, 4187, 4200
Downside Levels: 4120, 4100, 4085
QQQ
Keep reading with a 7-day free trial
Subscribe to Future Blue Chips to keep reading this post and get 7 days of free access to the full post archives.


