Technical Edge —
NYSE Breadth: 26% Upside Volume
Advance/Decline: 26% Advance
VIX: ~$19.50
For swing traders, today’s a great reminder that we need to have some patience. Let’s see how the market handles this gap-down. Within the opening hour, I expect a decent bounce, but it’s what happens after that will matter.
Basically, will they gobble this dip up or will the rally fizzle?
Second, we’ve been in need of some consolidation after this major run. It’s a good thing to see the market cool off and it will be key to see what kind of “cooling” it will materialize into.
S&P 500 — ES
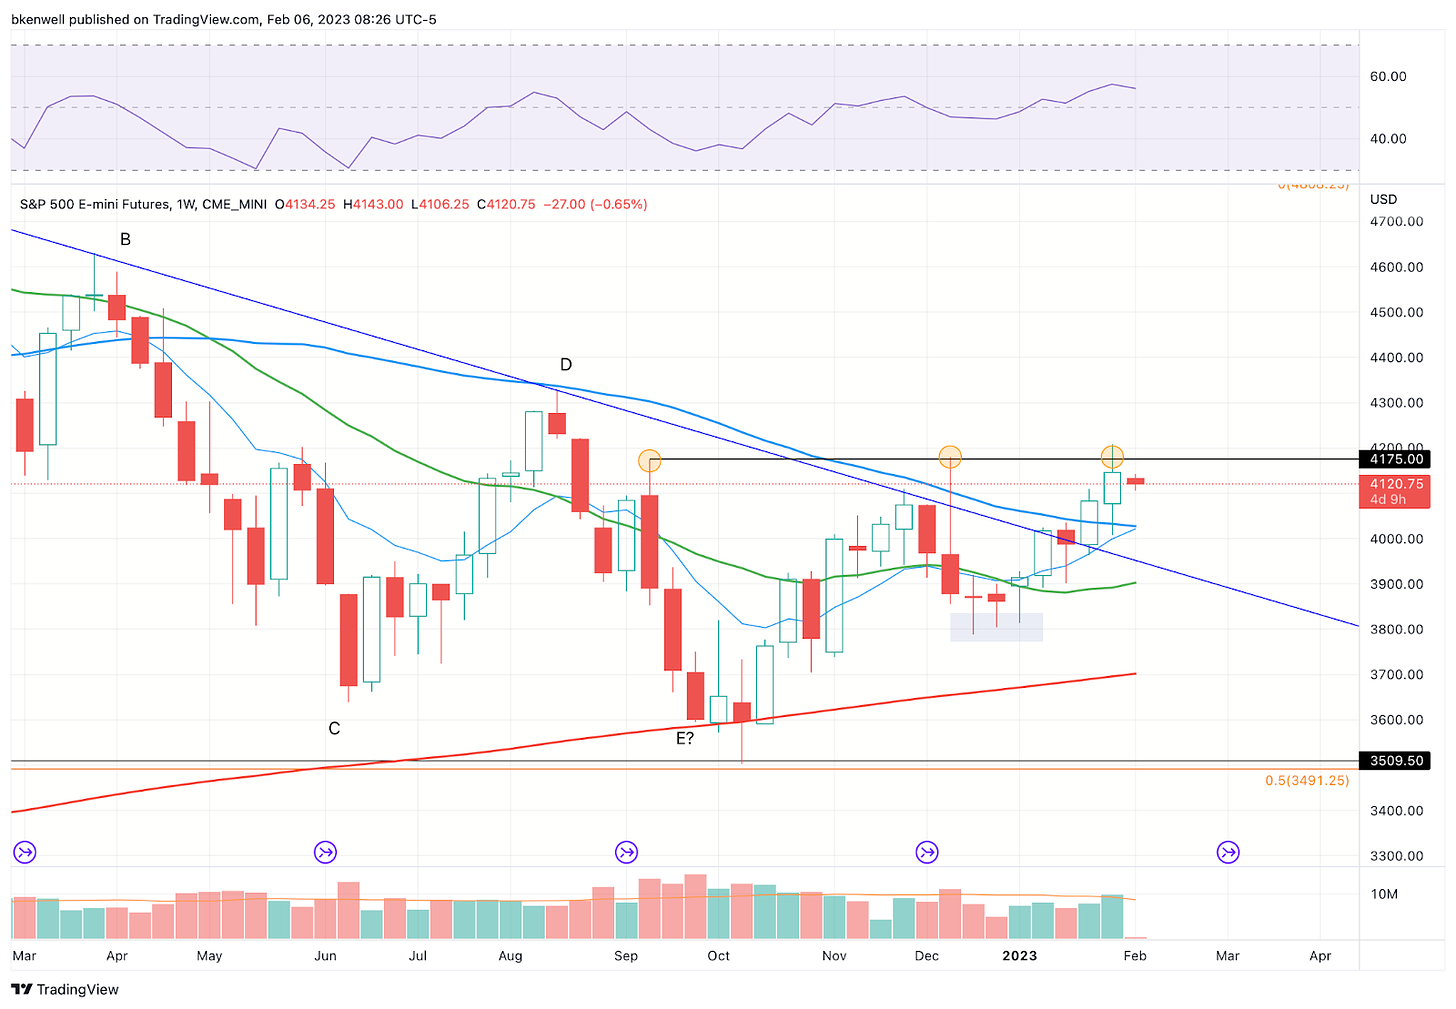
The weekly chart above shows pretty clear resistance in the 4175 to 4200 area. That said, the ES built a higher low in December and is now back above downtrend resistance (blue line) and the 50-week moving average.
Clear positives.
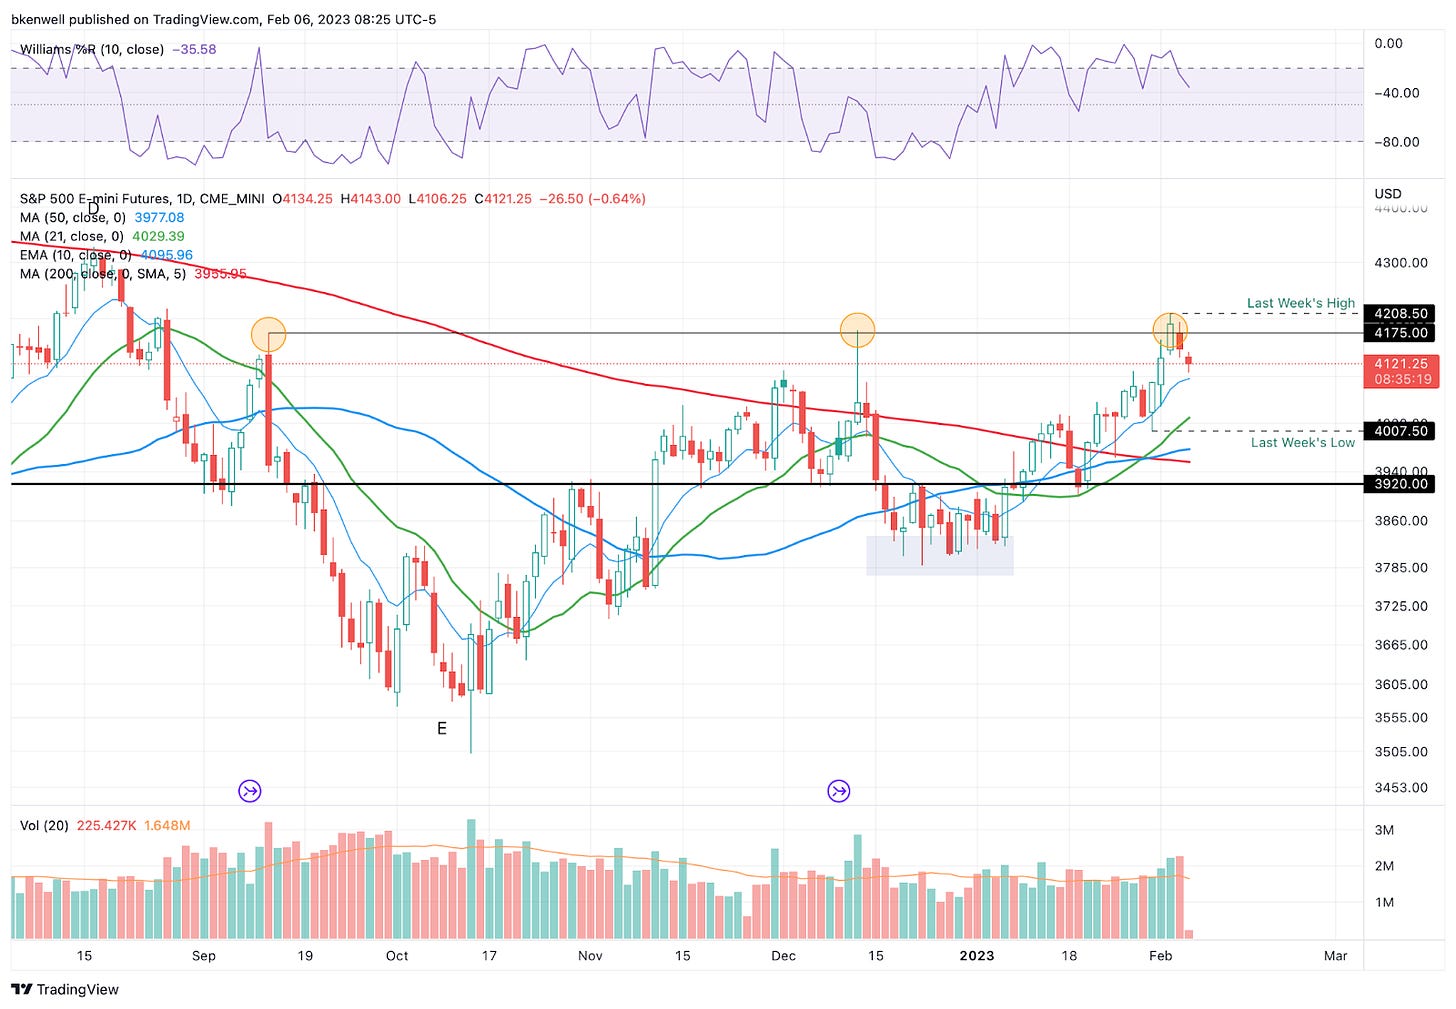
It’s also above all of its daily moving averages, as shown below, including active support via the 10-day ema.
Now the ES finds itself in a bit of a tough spot. The poor earnings results out of FAANG and the implication for higher rates following the roasting hot NFP report do not seem to bode well for the future.
That said, one can look at the two charts from above and conclude that there have been some really nice technical developments.
My question now becomes: Will the ES find buyers at active support (the 10-ema) and if not, will it again put in a higher low, (avoiding a retest of the ~3,800 area)?
This is sort of a “bigger picture” look rather than an exact trade setup, but I have an open mind — both long and short — about how we could progress and I think that’s the best way to approach this.
SPY
Keep reading with a 7-day free trial
Subscribe to Future Blue Chips to keep reading this post and get 7 days of free access to the full post archives.


