Technical Edge —
NYSE Breadth: 7.5% Upside Volume (!!)
Advance/Decline: 13% Advance (!)
VIX: ~$22.75
We almost got ourselves a 90/90 downside day, where breadth and the advance/decline figures are both below 10% on the day. The A/D measure narrowly avoided it.
Still, yesterday’s action was quite ugly. The breakdown in regional banks (KRE), along with the weakness in JNK and HYG certainly raises an eyebrow.
In regards to the AVGO and CRM setups from yesterday, they did not quite trigger (surprisingly), but man, I am apt to step aside from fresh longs in individual stocks at the moment.
Yesterday’s move was…how do I say it? “Alarming” may not be the right word, but kind of.
Keeping today’s outline tied strictly to the indices for now.
S&P 500 — ES
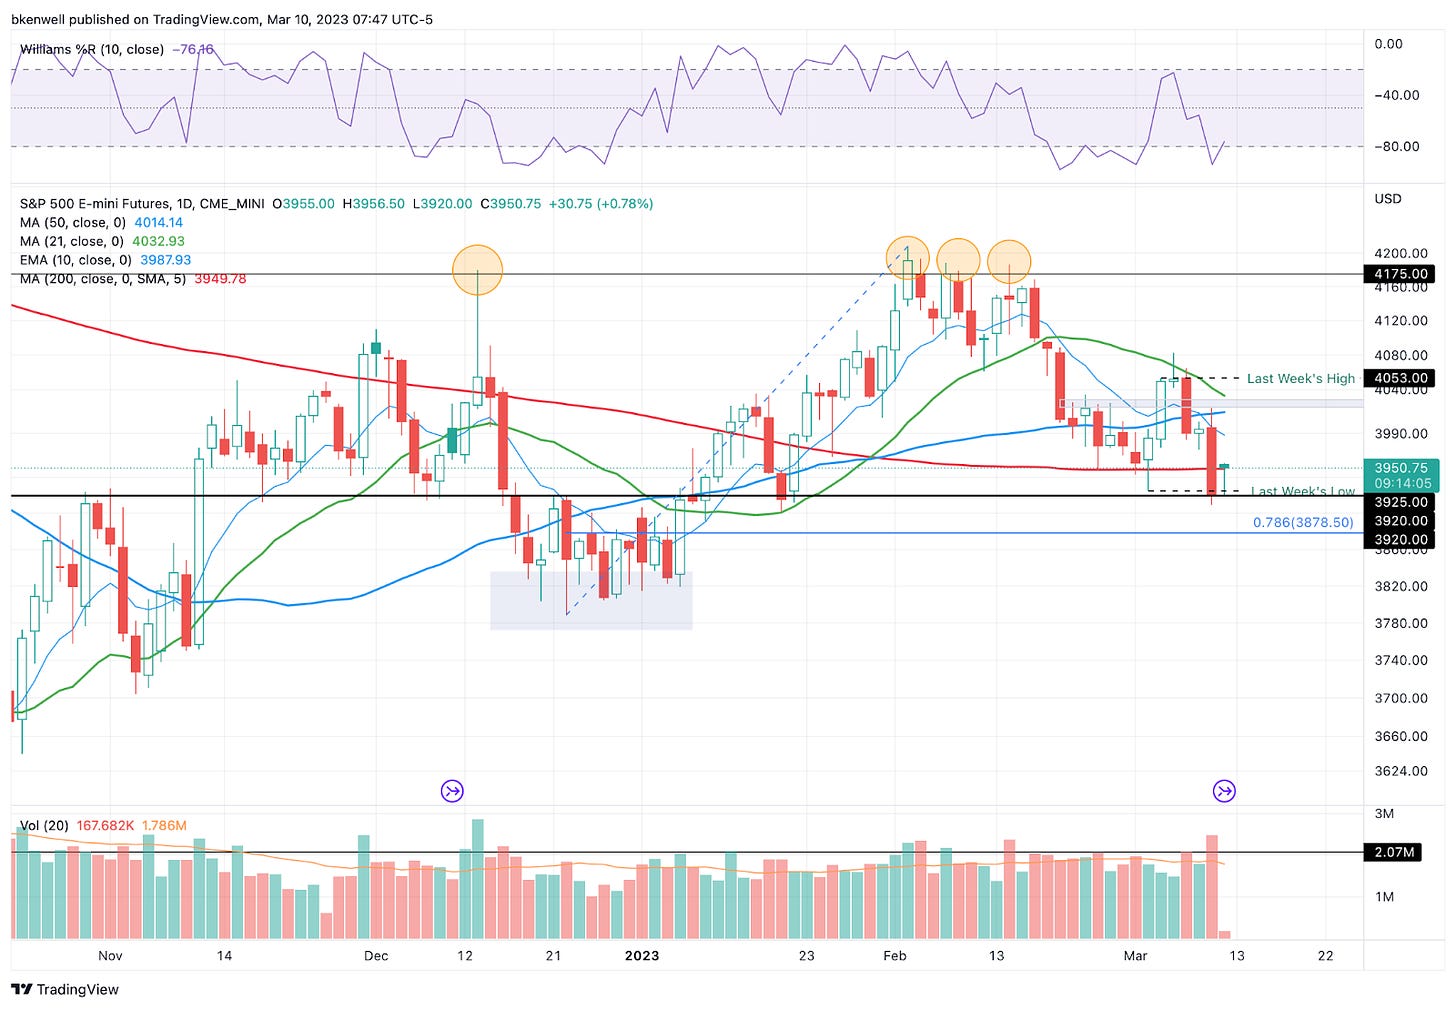
After a look above Wednesday’s high, Thursday’s action fell apart quickly, sending the ES down to last week’s low and the vital 3920 level (remember that one?)
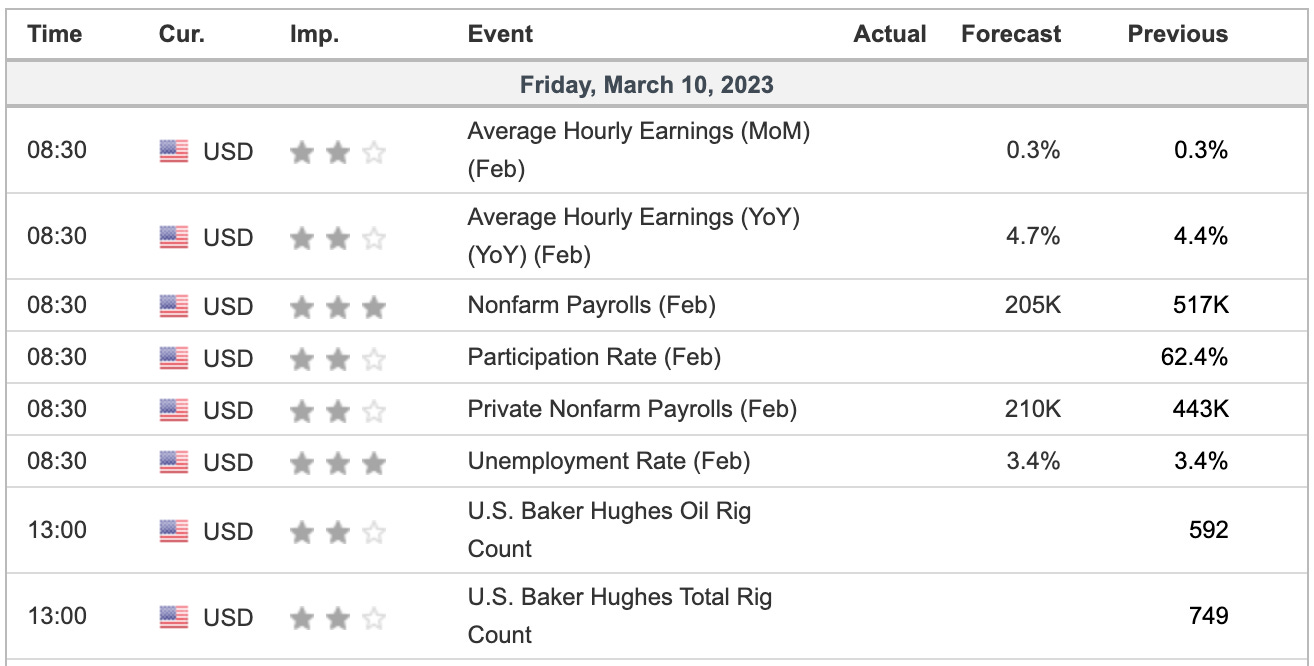
For now, this area is holding, but I wouldn’t put too much emphasis on it. It will all come down to the jobs report today, or least for the first half of today.
The Trade: Watch 3910-20. That’s the key pivot and yesterday’s low. Last week’s low is at 3925.
A flush of these measures puts 3900 in play, then 3878.50 — the 78.6% retracement.
I don’t necessarily expect 3820 to 3840 today — down 2% to 2.5% from yesterday — but that’s where this could head if 3878.50 fails.
On the upside, 3950 is a key level to regain. That’s followed by 3965 and 3978. Ultimately, 4,000 is still resistance.
SPY
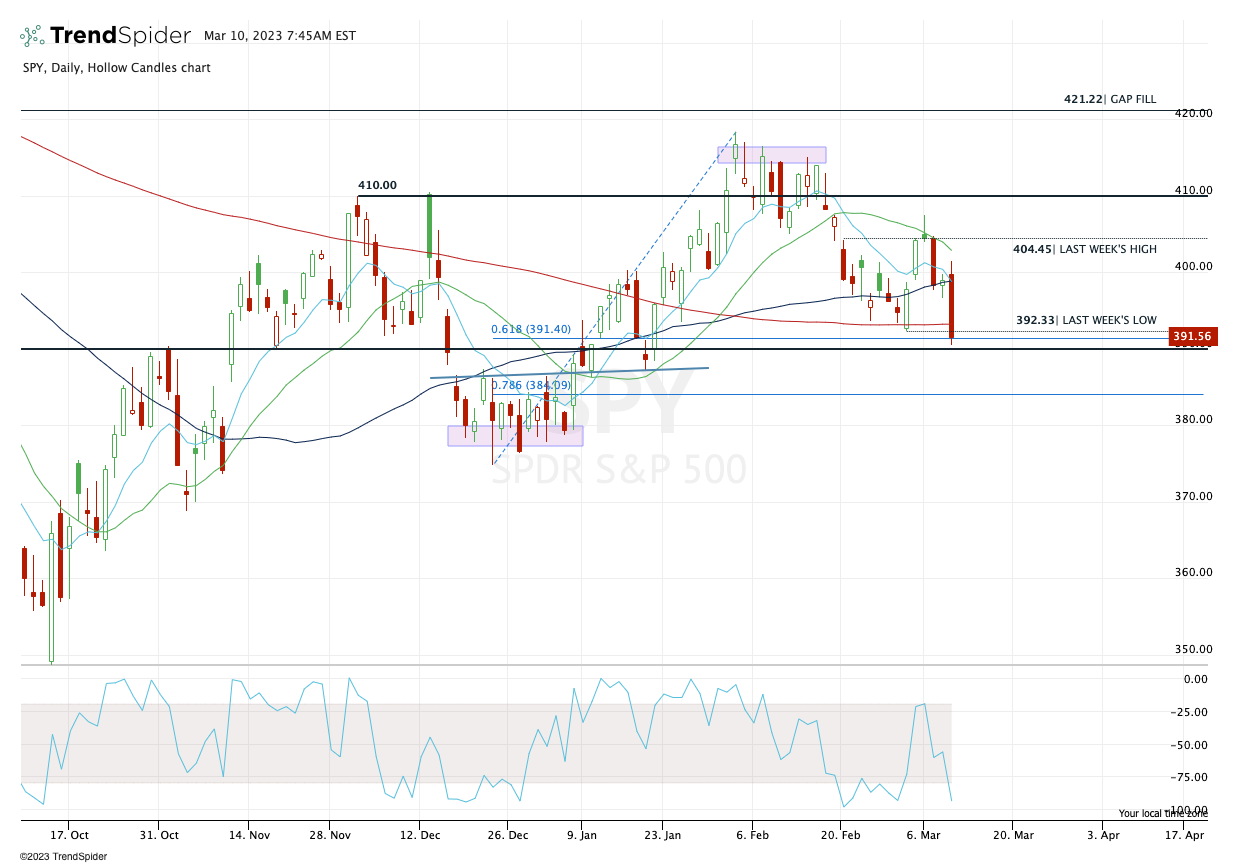
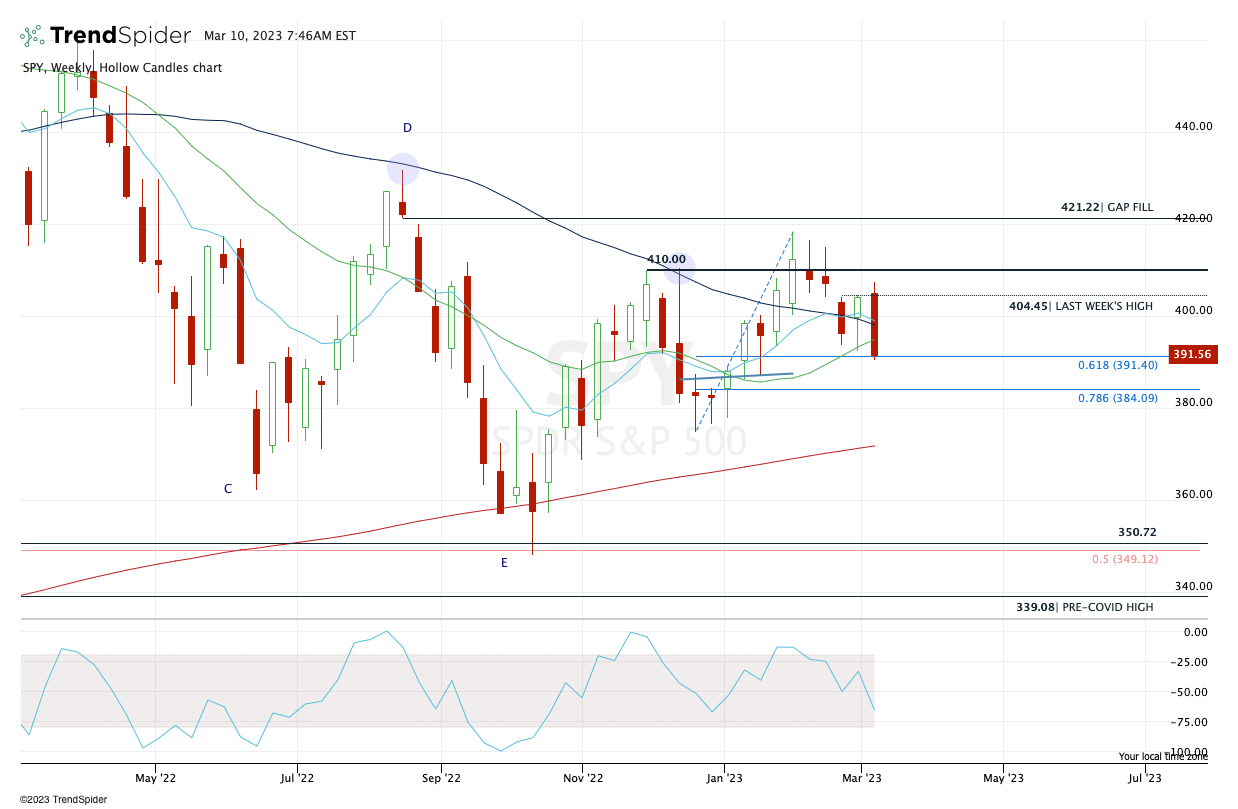
Daily chart above, weekly chart below for SPY.
The SPY is into a big area on the downside, with last week’s low, the $390 pivot and the 61.8% retracement. If this area folds, $384 is on the table, then the $378s.
On the upside, SPY needs to regain the $393s. Above that and $396 to $397 may be resistance.
We are now at risk for a bearish engulfing week, as the S&P 500 opened above last week’s high, failed on the push higher and is now below last week’s low.
That sets a very bearish tone — but we still have to get through Friday.
Could it ultimately set up a test of the 200-week moving average? Perhaps. But sticking with today’s action, the weekly close for the SPX and SPY is vital.
Nasdaq | QQQ & NQ
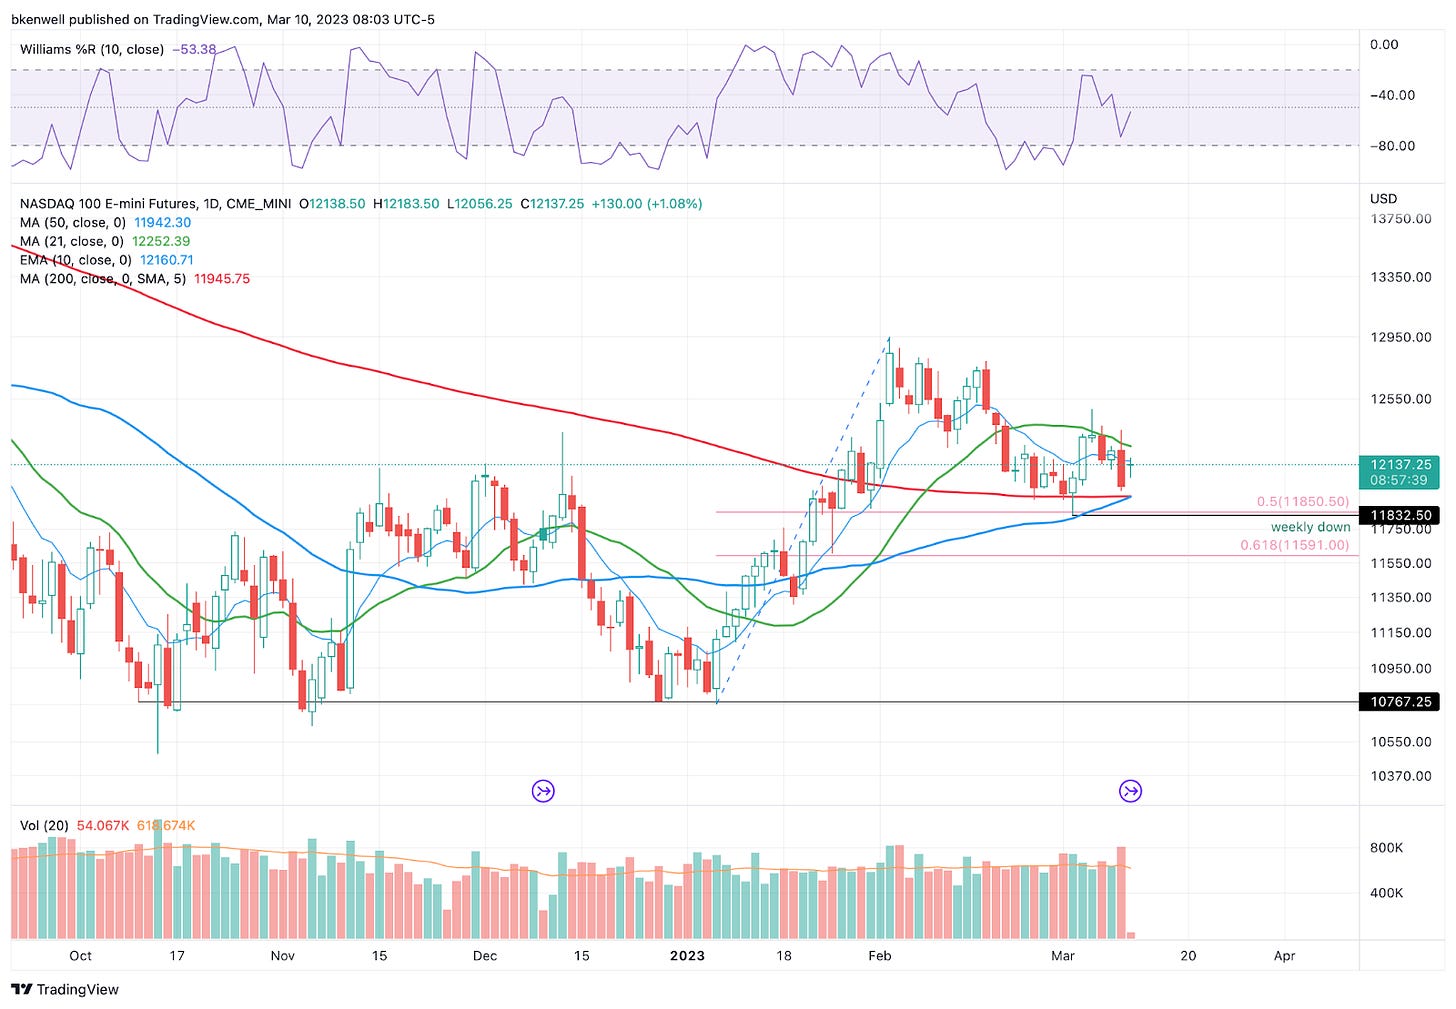
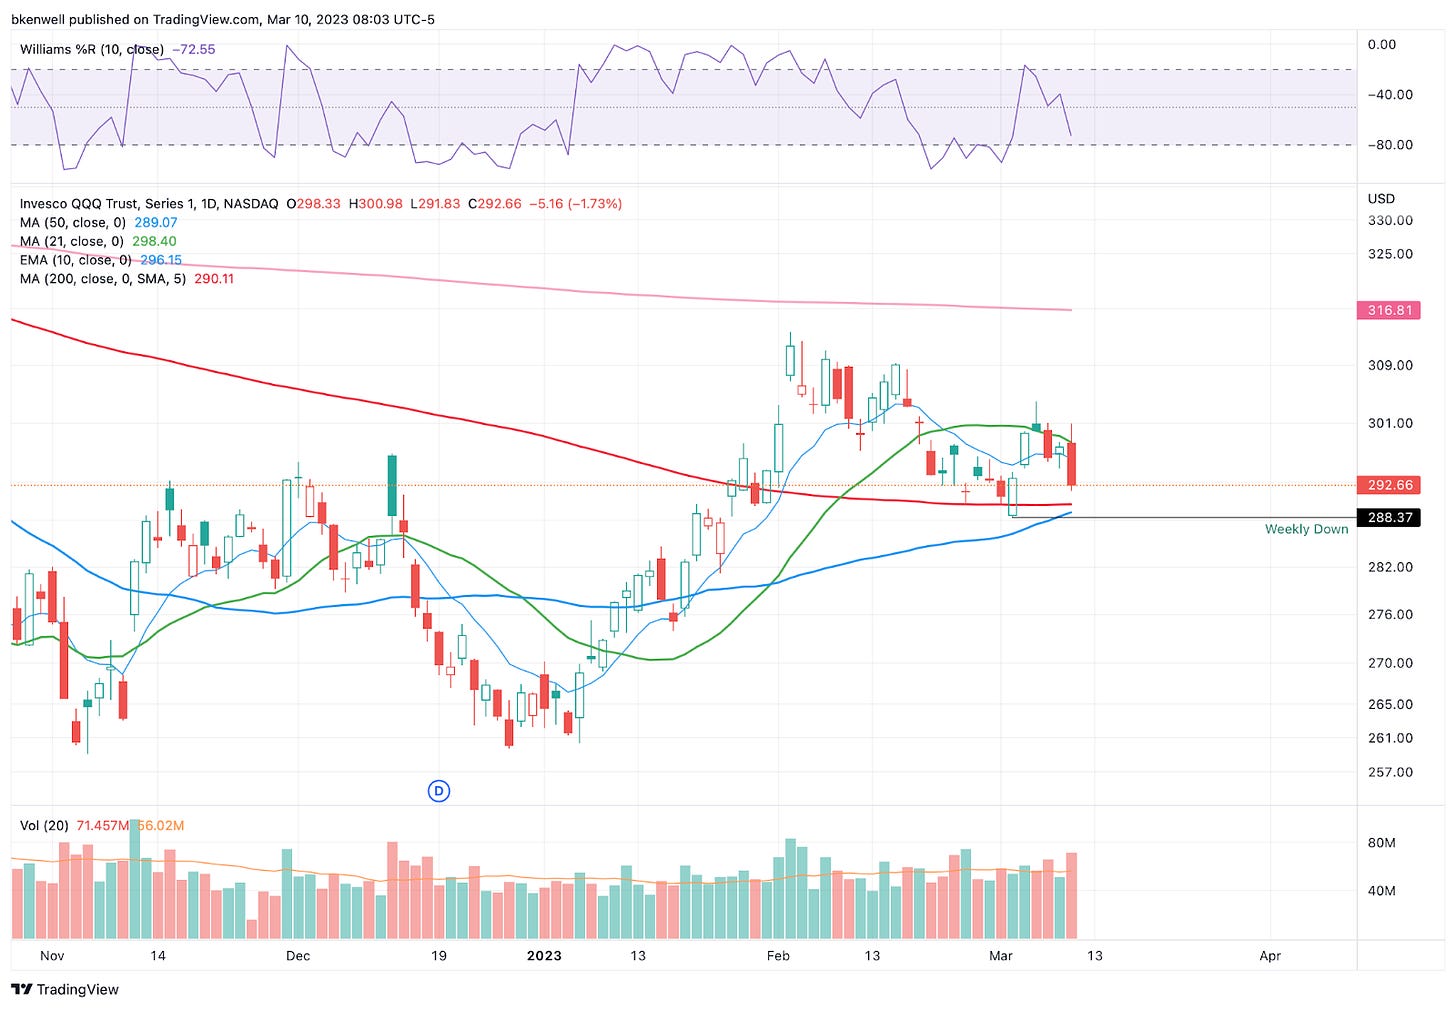
NQ futures above, with the QQQ below (both daily charts).
Both the NQ and the QQQ are holding up better than its S&P counterparts. On a bearish reaction today, watch last week’s low.
For the NQ that’s 11,832.
For the QQQ that’s $288.37.
These measures are less than 2% away from yesterday’s low, so a similar or worse decline than Thursday puts weekly-down on the menu (and would firmly bury the S&P).
It would also mean that the QQQ and NQ will lose the 200-day and 50-day moving averages as support, just as the latter was trying to cross the former. That’s what many traders refer to as a “Golden Cross,” a typically bullish signal.
In any regard, keep an eye on these downside levels today.
On the upside, let’s see how the NQ handles the 11,500 to 11,550 area, which bulls want reclaimed. For the QQQ, that’s $296.50 to $297.50.
Note: Losing last week’s low would also trigger a bearish engulfing candle.
Open Positions
Bold are the trades with recent updates.
Italics show means the trade is closed.
Any positions that get down to ¼ or less (AKA runners) are removed from the list below and left up to you to manage. My only suggestion would be B/E or better stops.)
** = previous trade setup we are stalking.
MRK — Long from ~$110 and (disappointing action as it was oh-so-close to our first target, missing by a few dimes) — Ideal stop is clearly defined near $105. Initial target for ⅓ trim is $112.50.
Natural Gas, UNG or /NG — First target hit at UNG ~$10 and NG at 2.95 to 3.00.
Now /NG needs to hold the $2.40 to $2.50 mark in order for bulls to stick with this one. If it holds, I would love to see Friday’s highs hit again (the target of our prior trim).
AMD — Long on weekly-up over $81.63 — We got a third trim in AMD at $86 but not quite another trim at $88. That’s okay. B/E stop or full exit is fine.
SMCI — Got our $104+ trim target, then B/E stop as we SMCI reversed and we were clocked out.
Go-To Watchlist
*Feel free to build your own trades off these relative strength leaders*
Relative strength leaders →
NVDA, CRM
PANW, FTNT
SMCI, AVGO
WYNN, LVS → would love a reset to the 10-week ema
GE → would love a reset to the 10-week ema
FSLR
AQUA
TSLA
SBUX, ULTA, NKE
AEHR → volatile!
MELI
AXP → would love a reset to the 10-week ema
BA & Airlines — AAL, DAL, UAL
CAT


