Technical Edge
NYSE Breadth: 54% Upside Volume
Advance/Decline: 54% Advance
VIX: ~$13.50
What was Monday? We called it a “Slow Start to a Busy Week” in yesterday’s prep piece, but what more can you expect from a summer doldrum day with no events on the calendar?
It showed in the volume too, essentially match the low-volume days of May 8th and 9th, as well as the holiday week in December. Welcome to summer.
Now more bank earnings are on deck with BAC, MS and PNC, while TSLA and NFLX kick off tech tomorrow. Because of Monday’s “no day,” many of the index setups below are the same. Below those and we have three individual stock trades to watch (SBUX, WMT & DAL).
Good luck today.
SPY
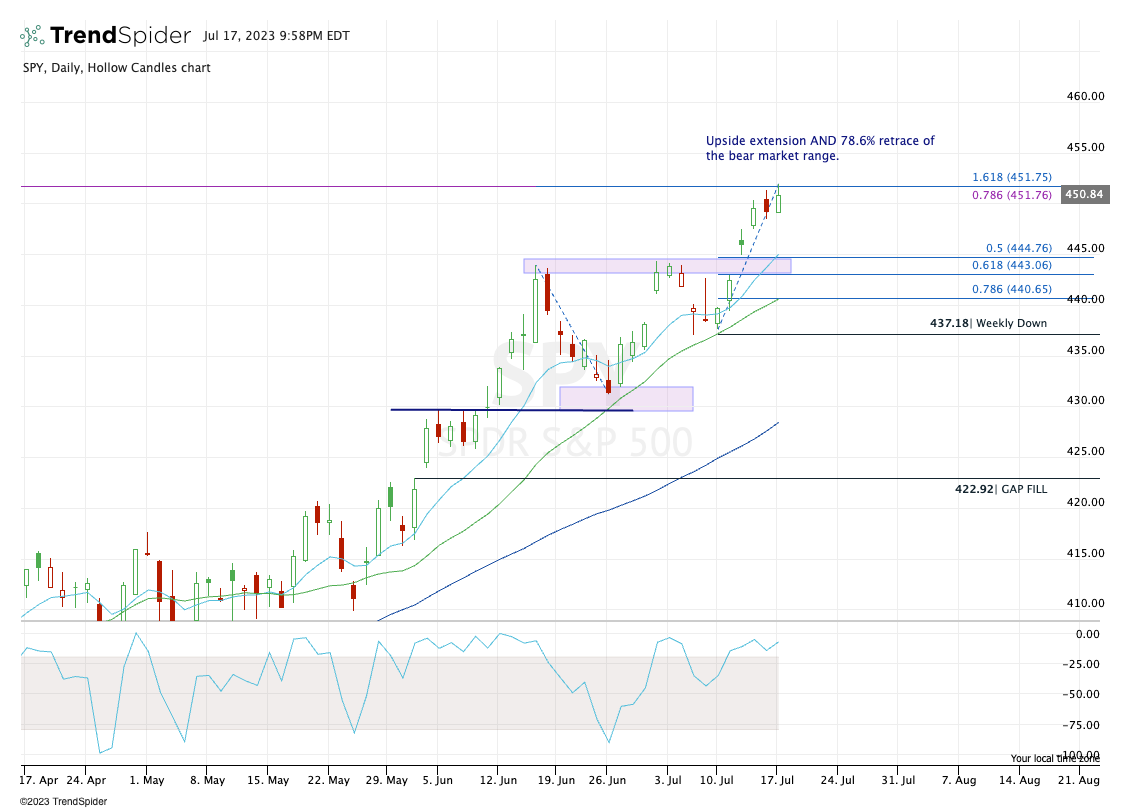
Continues to stall around the $451.75 mark. Bearish scalpers have cleaned up at this level in back-to-back days now. We are definitely not saying the S&P will surely pull back — not at all — but a dip-buy is simply our top setup in the S&P at the moment.
Upside Levels: $450, $451.75
Downside Levels: $449, $447.50, $446, $444
S&P 500 — ES Futures
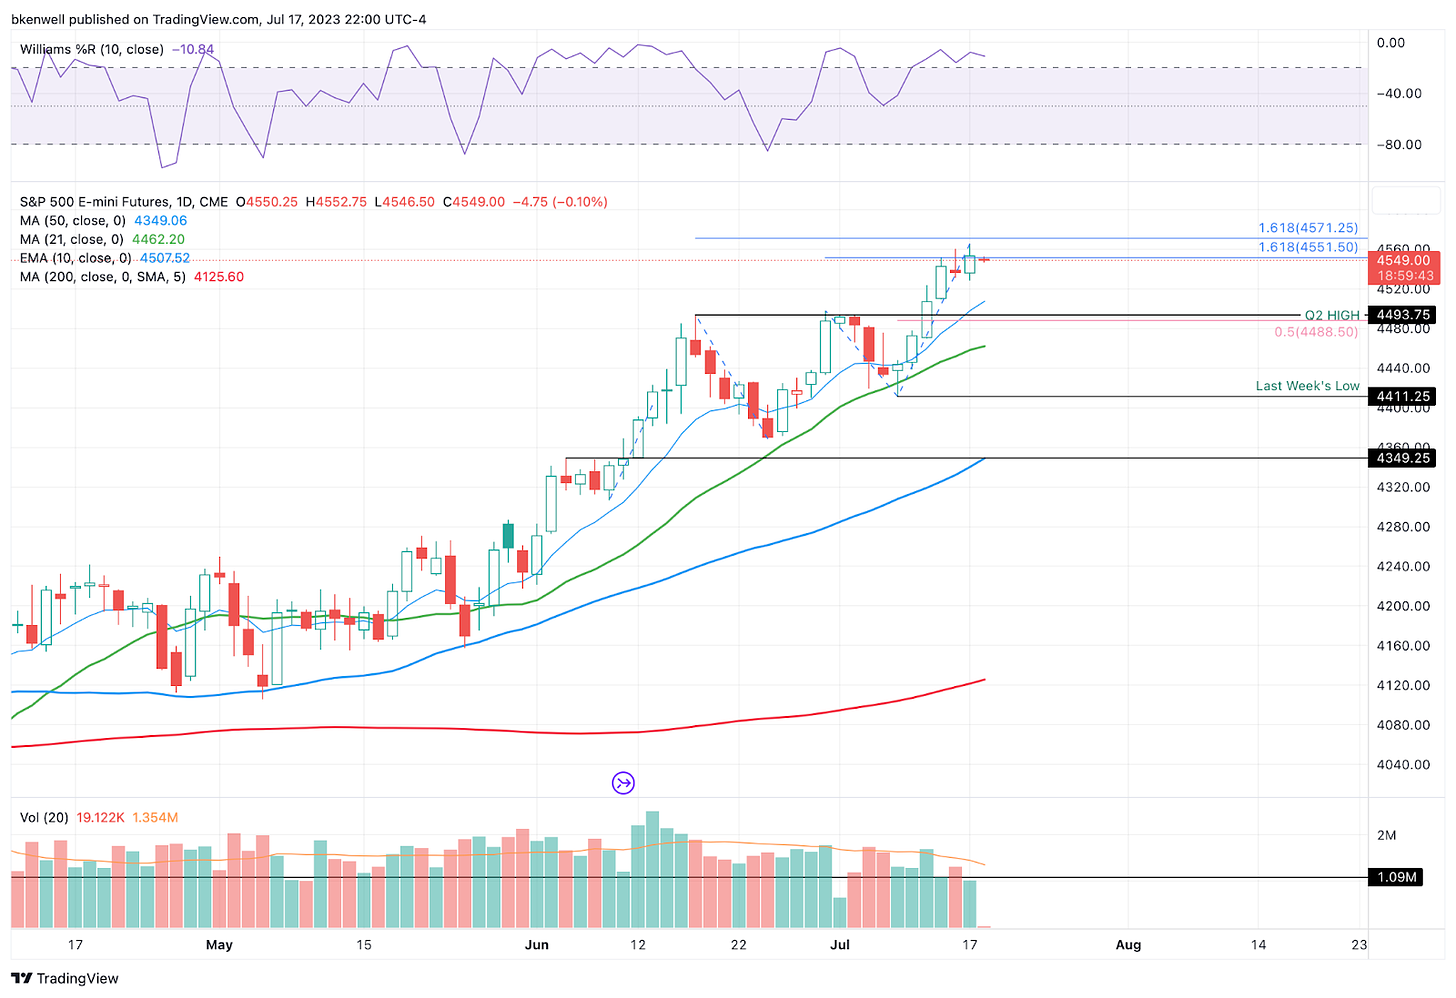
Upside Levels: 4551, 4560, 4571.25
Downside levels: 4525-28, 4510, 4485-4495
SPX
Upside Levels: 4533-35, 4550
Downside Levels: 4500-05, 4472, 4450-55
NQ + QQQ
Same levels/setup as Monday.
Upside Levels: 15,730, 15,855
Downside Levels: 15,700, 15,555, 15,440-60
QQQ
Upside Levels: $380, $382.50 to $383
Downside Levels: $375.50, $371-73
DIA & YM
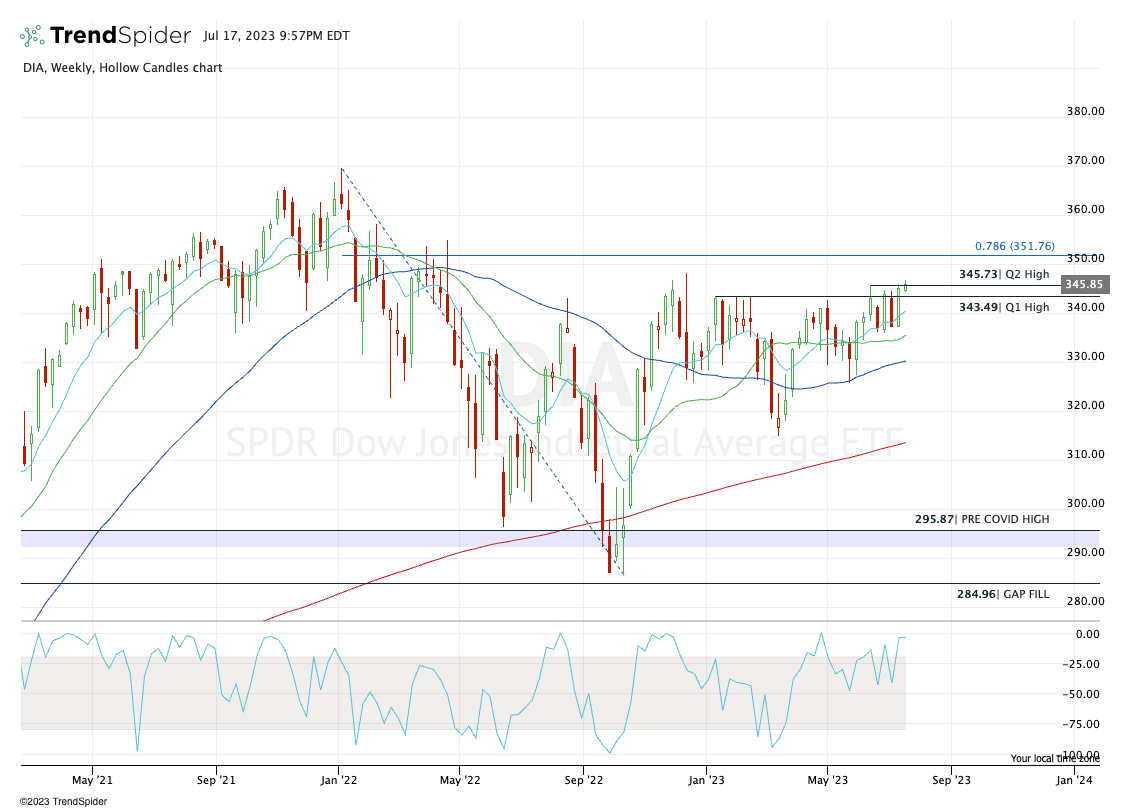
The DIA ETF is trying to rotate over a couple of quarters worth of highs. Over the Q2 high and we could see a move to the 78.6% retrace, then potentially much higher.
Remember, the Dow has been a dog this year — up just 4.4% in 2023 — but it’s held up the best amid the bear-market selloff. A close over Monday’s high could keep the bull party going.
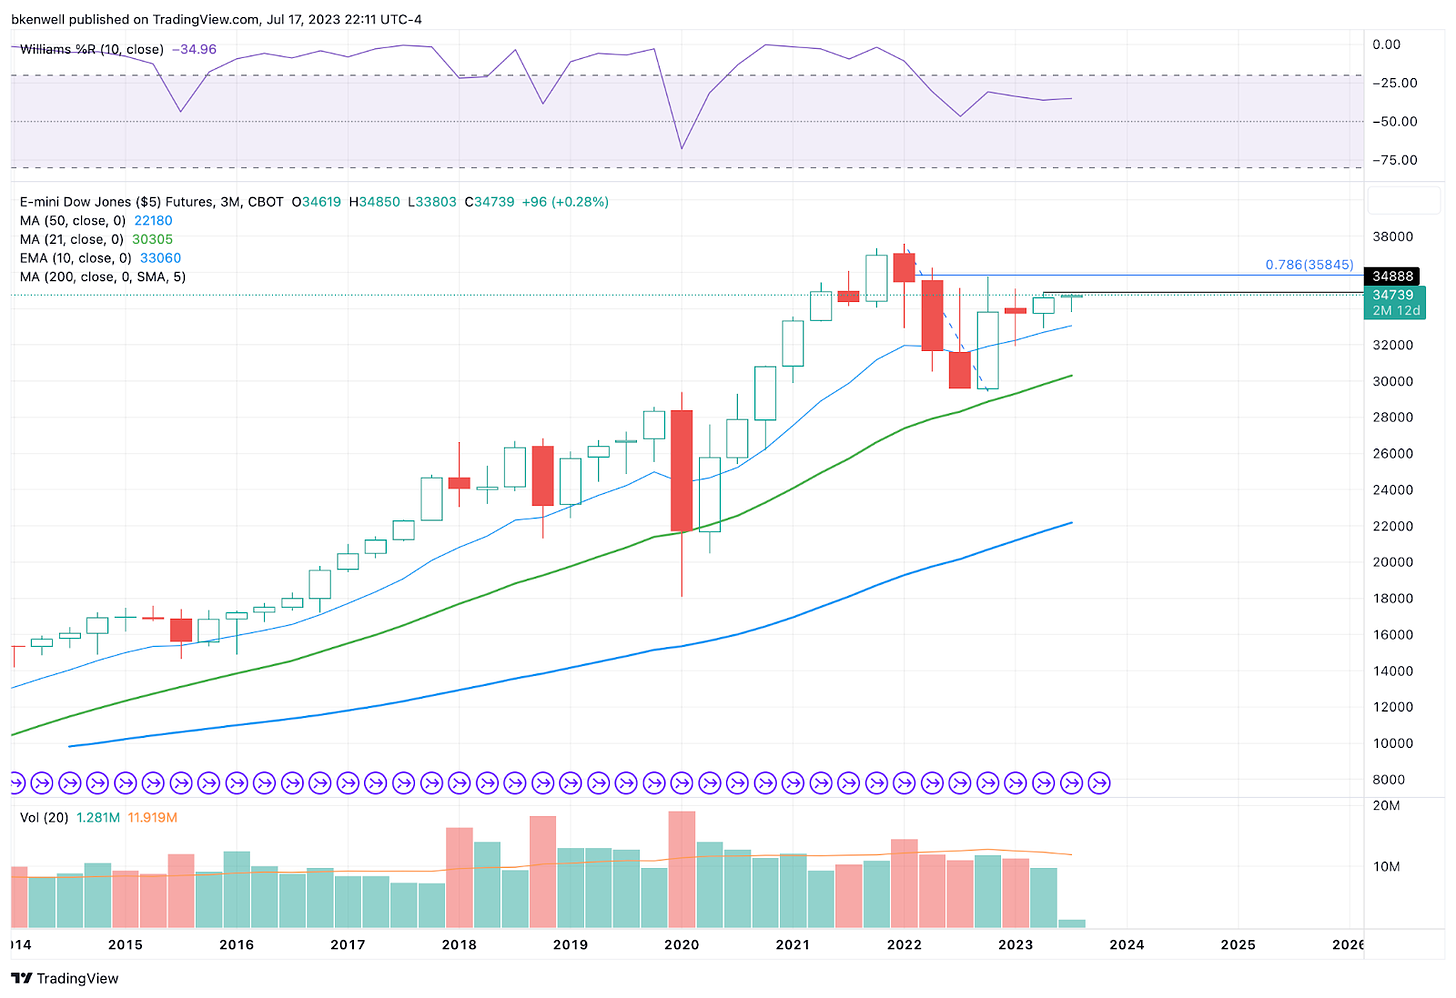
Here’s the Futures setup on the quarterly chart, if that’s an easier visual for you futures traders:
IWM
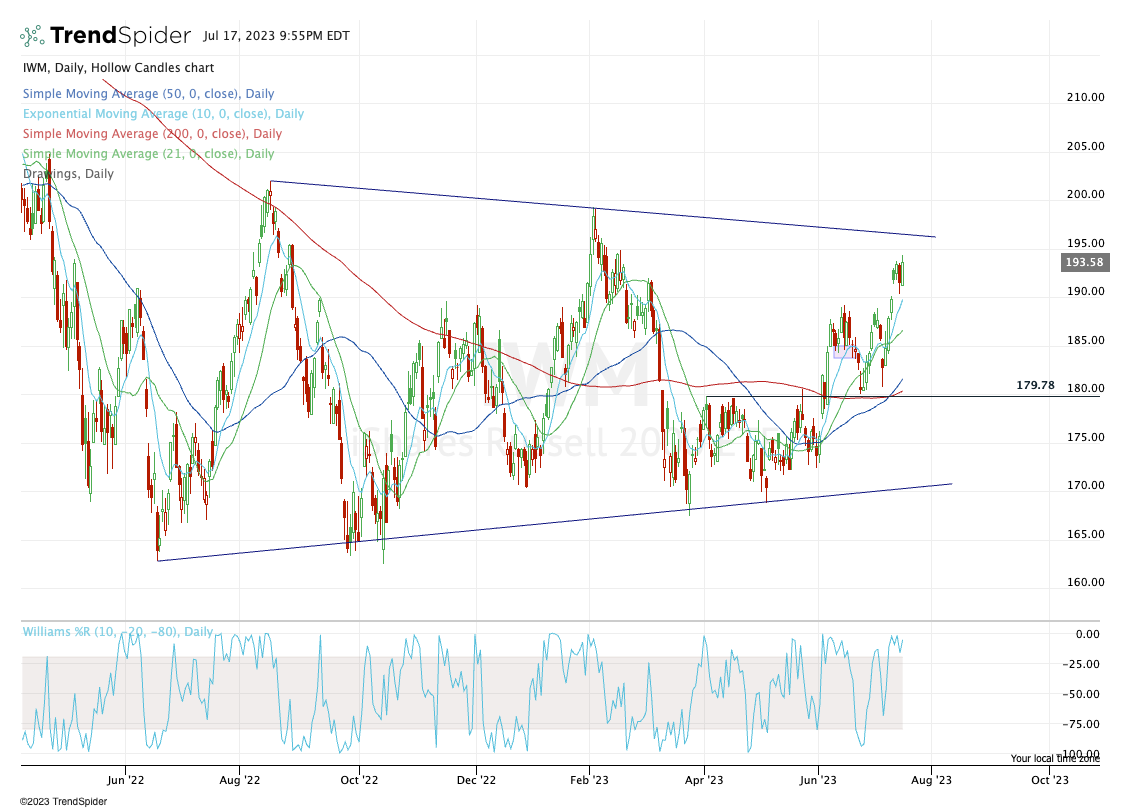
Potential resistance looming ahead, but like the Dow, a move over $200 could get the catch-up trade going.
That’s as the IWM perfectly held the ~$180 area. Nice trade there if you caught it.
TNX
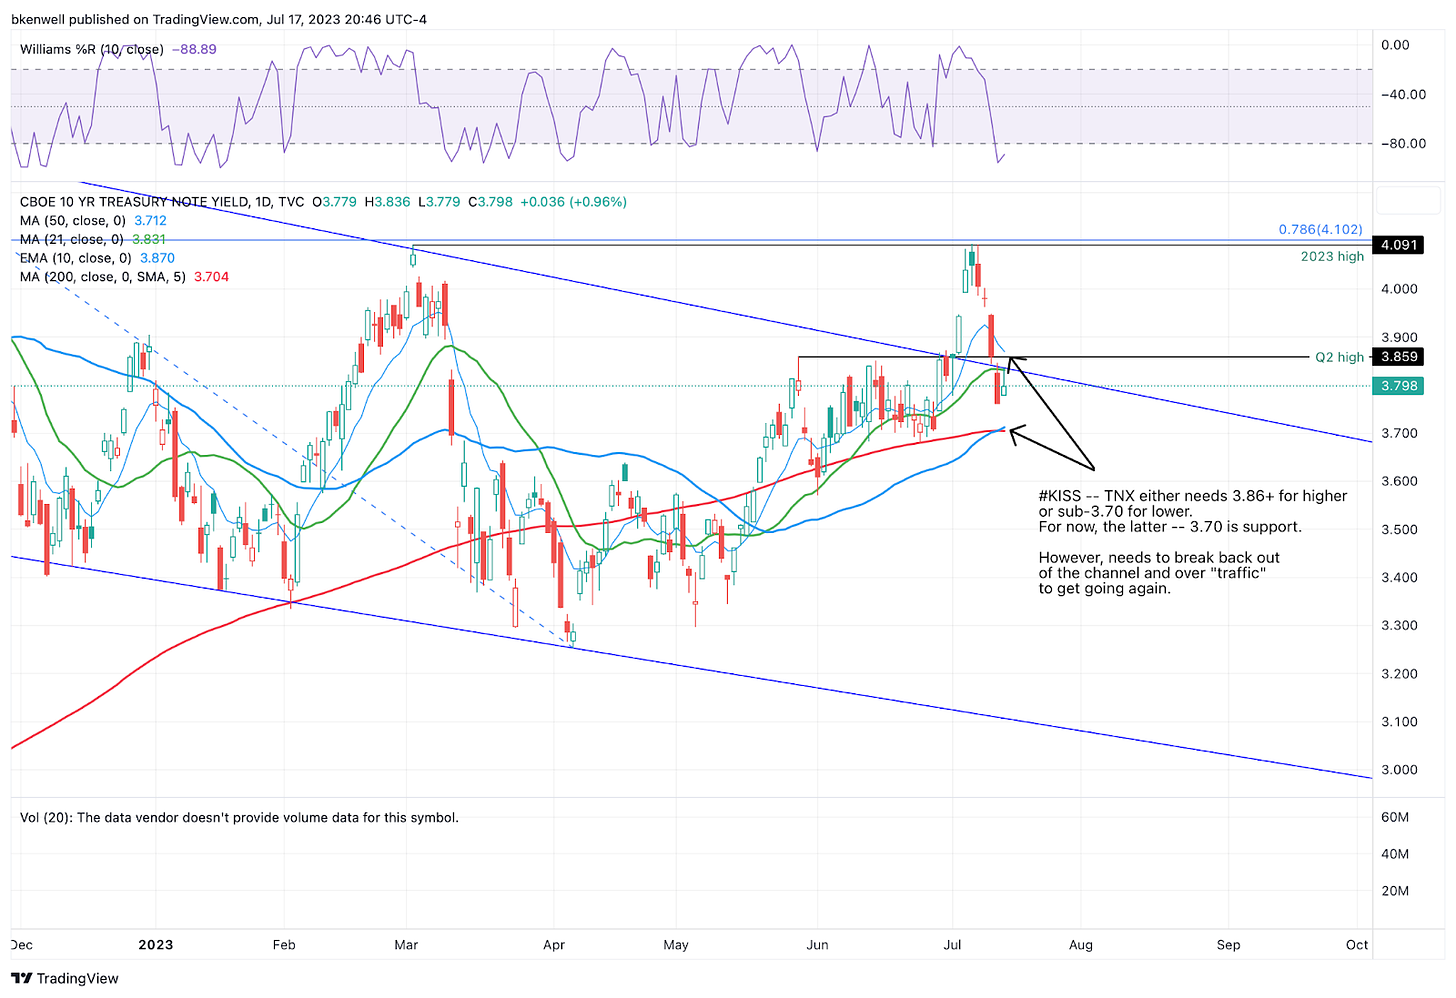
Lastly, just look at the chart above for yields (or TNX), which is back into its downward channel.
Keep it simple: Up over 3.86 gets it back above the Q2 high and all of its key moving averages. A dip down to 3.70 needs to hold as support, or lower yields are on tap.
Lower yields = bullish for stocks and bonds, generally speaking, and vice versa.
SBUX
Keep reading with a 7-day free trial
Subscribe to Future Blue Chips to keep reading this post and get 7 days of free access to the full post archives.


