Analysis: ARKK Looks Awfully Similar to the Nasdaq From 2000
Trades on NVDA, AAPL, SPY and more. Let's go!
Technical Edge —
NYSE Breadth: 81% Downside Volume (!)
NASDAQ Breadth: 71% Downside Volume
I want to go in a different direction today.
I want to first note that I am not an analog guy, but I do believe history has a way of repeating because human emotions are a driving factor in our decision making and our emotions don’t change all that much over the years.
As it relates to the stock market, the Fed can be dovish or hawkish, different issues will emerge (9/11, Covid, etc.) and the market leaders will change. However, the price action can remain familiar and similar in many ways.
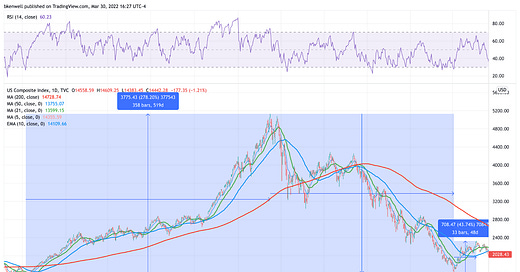
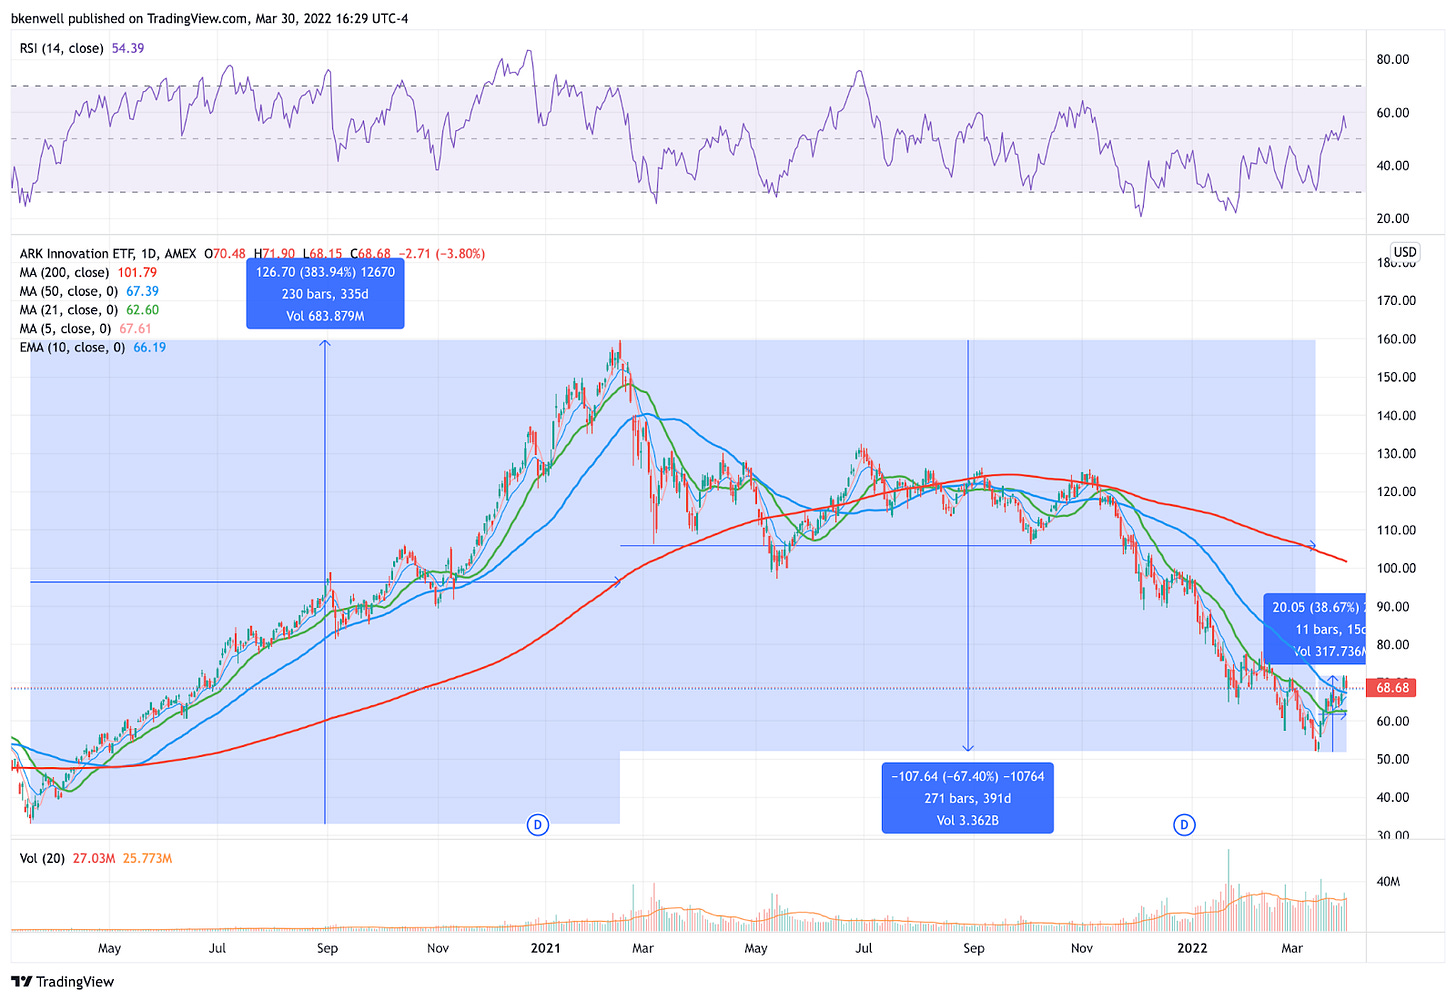
I want you to look at these charts of the Nasdaq Composite after the dot-com bust and then look at ARKK. During their respective haydays, these were the main focus all over CNBC, the newspapers and the internet.
The Nasdaq rallied 278% over 519 days, with that final blow-off top coming in the first quarter of 2000 (above).
ARKK had a larger rally over a shorter window, climbing 384% in just 335 days, but also topped out in the first quarter (below).
This is the interesting part though.
The Nasdaq fell 68.4% over 390 days after topping out. ARKK fell 67.4% in 391 days.
Wow.
The timing is incredible, although at this point I’m more interested in the rebound, the bottom and how we move forward.
I love growth stocks. So do plenty of others. It’s possible we get a V- or W-bottom off this massive decline. However, it’s also quite possible that commodity and value-based stocks continue to outperform while growth stocks form a longer base.
Look at how the Nasdaq traded after the big decline.
The Nasdaq rallied almost 44% in 48 days, finally reclaiming its 10-day, 21-day and 50-day moving averages. ARKK is doing that now and was recently up 38% from the recent low.
But after that initial burst, the Nasdaq traded sideways to lower before ultimately rolling lower in September. Just before retesting the low, it gapped down on 9/11.
Conclusion
Obviously we have to take some things into consideration here, like 9/11 accelerated the downward move.
However, despite some eerie and uncanny coincidences on the timing — such as the decline from the high and how long it took — the main takeaway is that ARKK may have some more upside in the short term, but may very well need more time to build a longer base.
This is important: Don’t look at ARKK to follow the Nasdaq’s price action from 20 years tick-for-tick, %-for-%. The idea is to get an understanding of the price action, which if history at least ryhmes, would suggest some longer term consolidation/base forming.
The tech space is far more durable than it was 22 years ago. AAPL, GOOGL, etc. are now safe-haven titans with massive balance sheets. That being said, we’re talking about the high fliers, not AAPL and GOOGL.
While there are high-quality growth stocks that will emerge bigger, better and stronger from the carnage — my short list looks something like SHOP, ROKU, TWLO, TTD, DOCN — there are only so many good ones compared to so many of the duds.
Just like how Apple and Amazon rose from the ashes, others will too. But it may take time!
Game Plan
S&P 500
Feel free to extrapolate this layout to the SPY and ES
Still stands from yesterday:
“I think we need to cough up ~100 points in the Spoo and see where things stand. That gets us back into the 10-day and 200-day moving averages. If they hold as support, the trend favors the bulls.
If they fail, then we have to start talking about a potential retrace and could put the 4390 to 4410 area in play next.”
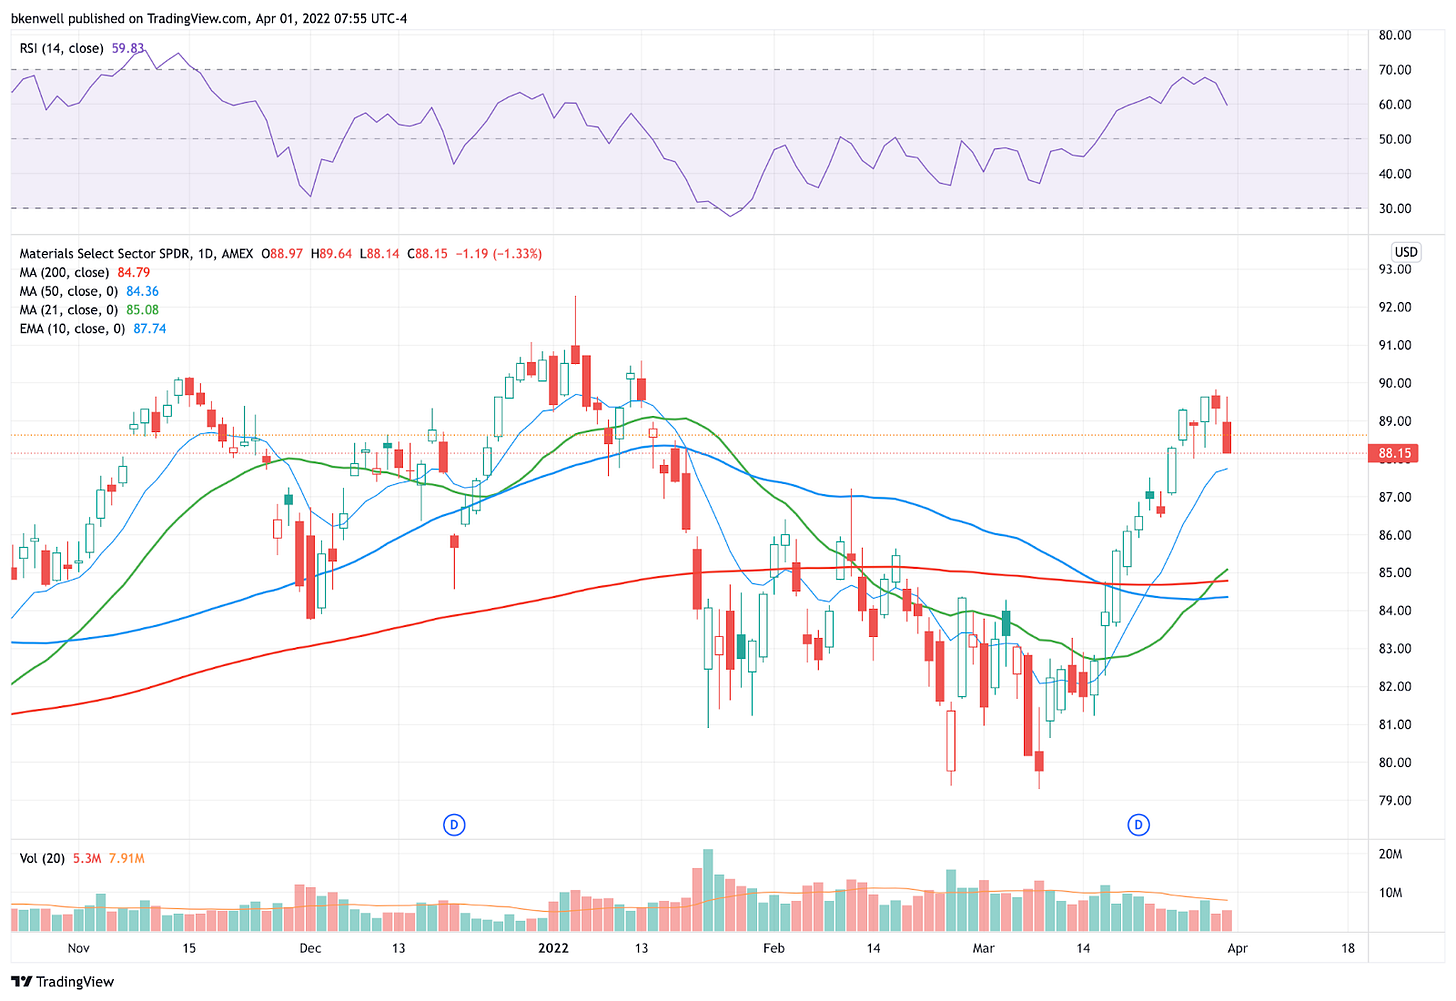
XLB
This was a high-numbered setup on the Go-To list yesterday. Let’s see if it can find its footing here near the 10-day.
Top holdings in the ETF with solid charts included on the watchlist below.
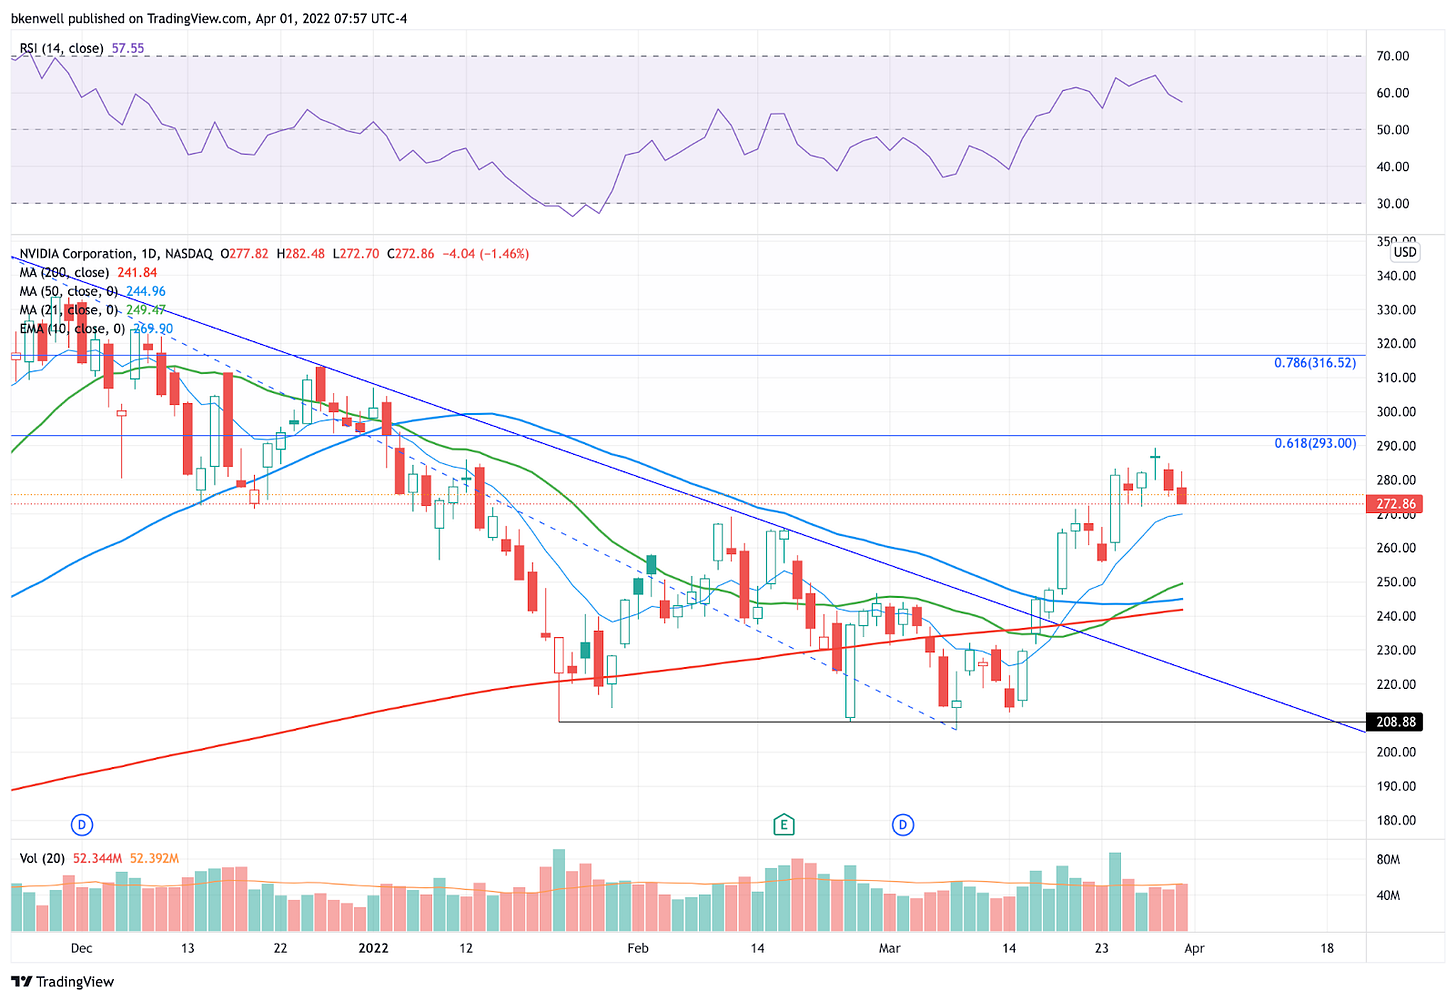
NVDA
Has been a leader in tech. Let’s see if we get some relief near $270. Key area and 10-day ema.
AAPL
$172 area is key.
AAPL has been another leader. If tech loses AAPL and NVDA, that’s not a good look. At all.
Go-To Watchlist
*Feel free to build your own trades off these relative strength leaders*
Numbered are the ones I’m watching most closely. Please look at these closely, as there are several updates (the most recent of which are noted in bold).
Watching XLB closely for dips! Leading stocks in materials include FCX, NEM, DOW, CTVA, NUE
PANW — Next trim spot is $645 to $650
F — stopped at B/E, but decent close.
COST — Down to runners or all out as $575 to $478 trim spot hit!
DLTR — Weekly-up triggered — $165 is the upside target.
NVDA —
MCK — looking for test of 10-day ema
BRK.B — Looking for possible support at 10-day ema
AVGO
VRTX
BMY
TU — Inside-and-up week at $25.80
MKC — finally punching back up through $99.
CCK
Energy — FLNG, XLE, APA, CNQ, CVX, ENB, PXD — etc.
ABBV
BROS
ADM, MOS
PANW
AR


