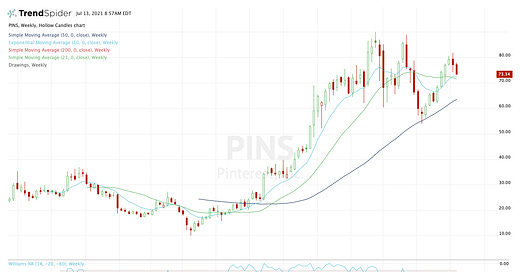
Did we nail Pinterest (PINS) or what? In May, we flagged the stock as it set up against its 50-week moving average amid declining volume and some divergence on its Williams %R reading.
That sounds like a jumbled mess. But it’s the complicated way of saying this was a solid risk/reward bottoming approach.
Plus it was a high-quality, high-growth stock that met my “bear-market buy” threshold. It went from a low of around $54 to a high north of $80, a 50% move in just 36 sessions.
Are we about to get another crack at Pinterest?
Trading Pinterest

Again, I’m back at the weekly charts with Pinterest. Talk to any swing trader and they will often tell you to work your way from the higher timeframes (weekly and monthly) down to smaller timeframes (like daily, 4H, 1H, etc.).
In this case, we got a beautiful bounce off the 50-week moving average. Currently pulling back, PINS is coming into its 10-week and 21-week moving averages between $71.50 and $72.50.
I like that area for a potential dip-buying opportunity. Why? Because we’ll know soon enough whether it will support the stock and lead to a bounce or if it will fail and potentially put the 50-week moving average back in play.
If it fails, we can cut our losses quickly and move on. If we get a bounce, $80 may be back in play and we can add to our recent gains in this one. Cheers!
Disclaimer: Charts and analysis are for discussion and education purposes only. I am not a financial advisor, do not give financial advice and am not recommending the buying or selling of any security.


