Just a few days ago, the market was “bending but not breaking.”
Not that the market is necessarily broken now, but the selling pressure is higher than what many investors had expected — myself included. To paraphrase, a few days ago, we said that while the market is not falling apart per se, it needs to hold current support or risk this mild correction turning into a more severe decline.
Well, that’s what we have now as support fails to hold.
I think a few things are worth noting.
Know your timeframe. There’s a big difference in trading the 5-15-30 minute timeframes vs. the daily/weekly setups. The person focused on the next 4-8 hours is going to have a different approach vs. the person focused on the next 4-8 weeks.
I’m not too keen on shorting into the hole. With the S&P down ~11 (technically 10) out of 13 sessions and down 240 handles from the high, I’m not looking to sell the lows.
Look for clues. When — not if — we bounce, how is prior support handled? Does the S&P quickly reclaim these levels or are these levels resistance? If it’s the latter, investors must be flexible enough to realize we could be in for a larger and longer correction.
Keep perspective. The SPX put had a 5-month win streak with a 21% gain. To give back 30% to 50% of that rally would be normal (and healthy).
Technical Edge
NYSE Breadth: 38% Upside Volume
Advance/Decline: 30% Advance
VIX: ~$18
SPY
The SPY continues to flush, but the selling has been controlled and breadth hasn’t really been exuberant on the downside. For instance, we’ve had one 80/80 downside day (breadth/decliners) so far this month.
Keep an eye on yesterday’s low of $435.75. That’s today’s pivot. Above and a bounce is possible — potentially all the way up over $440. If the SPY can’t get above and stay above $435.75, then $430 is possible.
Pivot: $435.75
Upside Levels: $440, $441.50, $444
Downside Levels: $430-$431
SPX
Pivot: 4364
Upside Levels: 4400, 4420, 4435, 4445-50
Downside Levels: 4328, 4300
S&P 500 — ES Futures
Watch 4370-75. A break of this area that isn’t regained puts 4350 in play. On the upside, 4400 and 4420 are on watch, followed by a possible move up into the 4460s.
Pivot: 4375
Upside Levels: 4400, 4420, 4460s
Downside levels: 4370, 4350, 4320-25
If we get a rally going, one can see how the 4406 to 4413 area could be an issue for the ES.
NQ
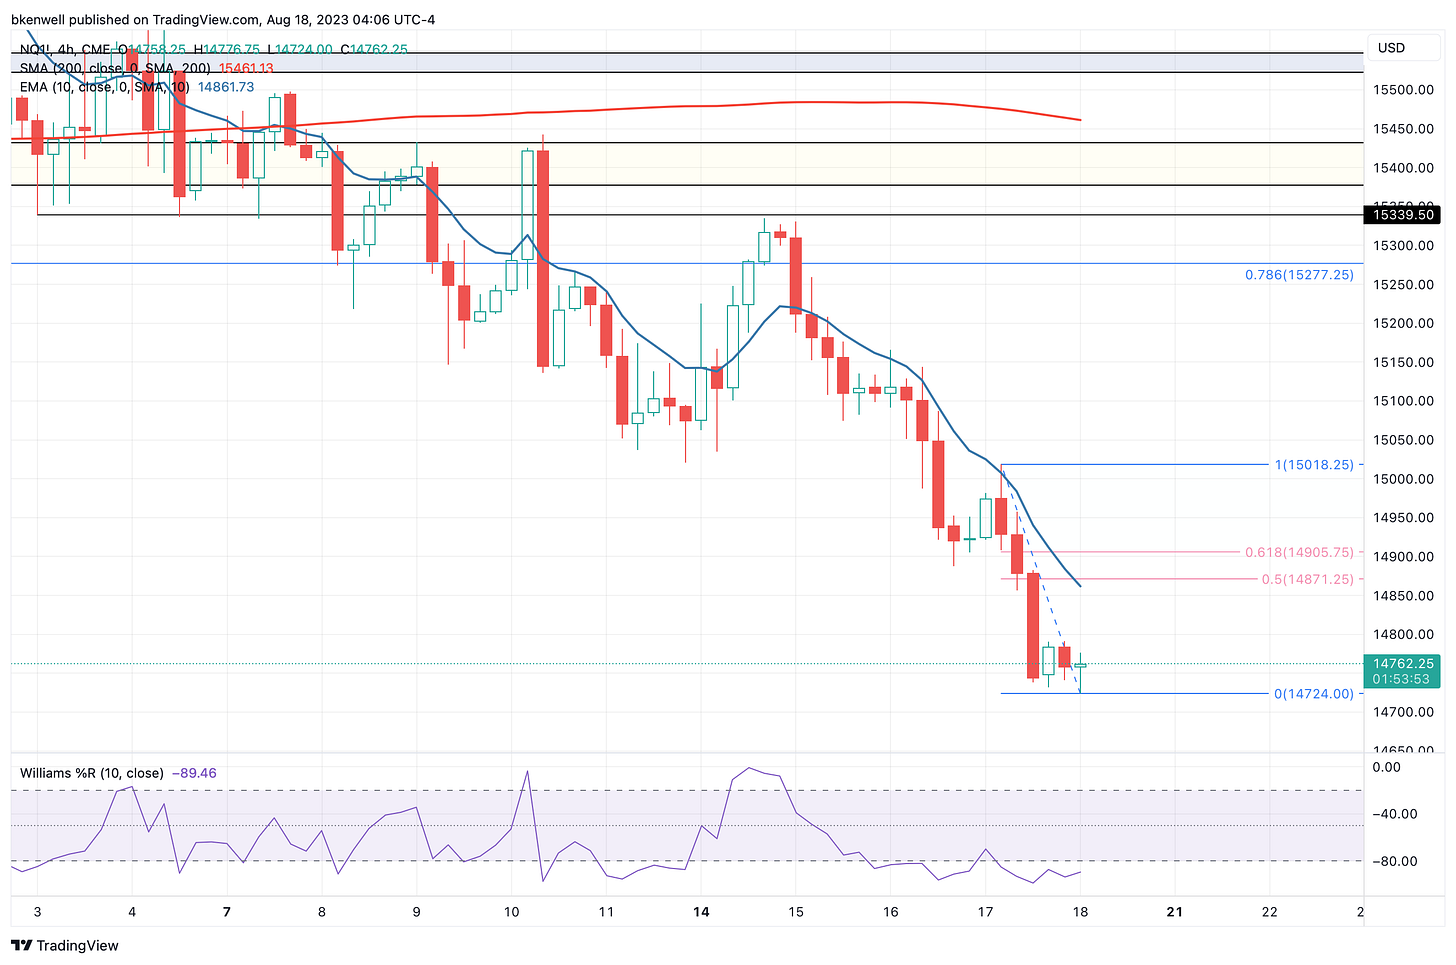
Well, well, well…look at that 14,750 to 14,850 area.
Let’s watch the Globex range. A break of the high without reversing and we can power back up to the 15,000+ area. A break of the low without regaining it and the sellers remain in control.
Daily & 4-hour:
Upside Levels: 14,870-905, 15,000, 15,100, 15,300-340
Downside levels: 14,725-750, 14,672-695, 14,425
QQQ
QQQ flush gave us into the $357 to $358.50 area. It’s hard for me not to be looking for a bounce here, especially if we were to open below yesterday’s $358.16 low and then quickly reclaim that level. That would probably have me looking at next week’s or the month-end $360 calls to speculate with.
This may not be the bottom, but odds of a bounce are growing IMO.
Pivot: $358.16
Upside Levels: $361.50 to $362, $364.50 to 365.75, $367.50
Downside levels: $354.50, $352
TNX — 10-Year Yields
Within spitting distance of the 52-week/multi-year high of 4.333. Until TNX takes a chill pill, it’s a headwind for equities…as stock traders suddenly seem to care about yields.
CRM
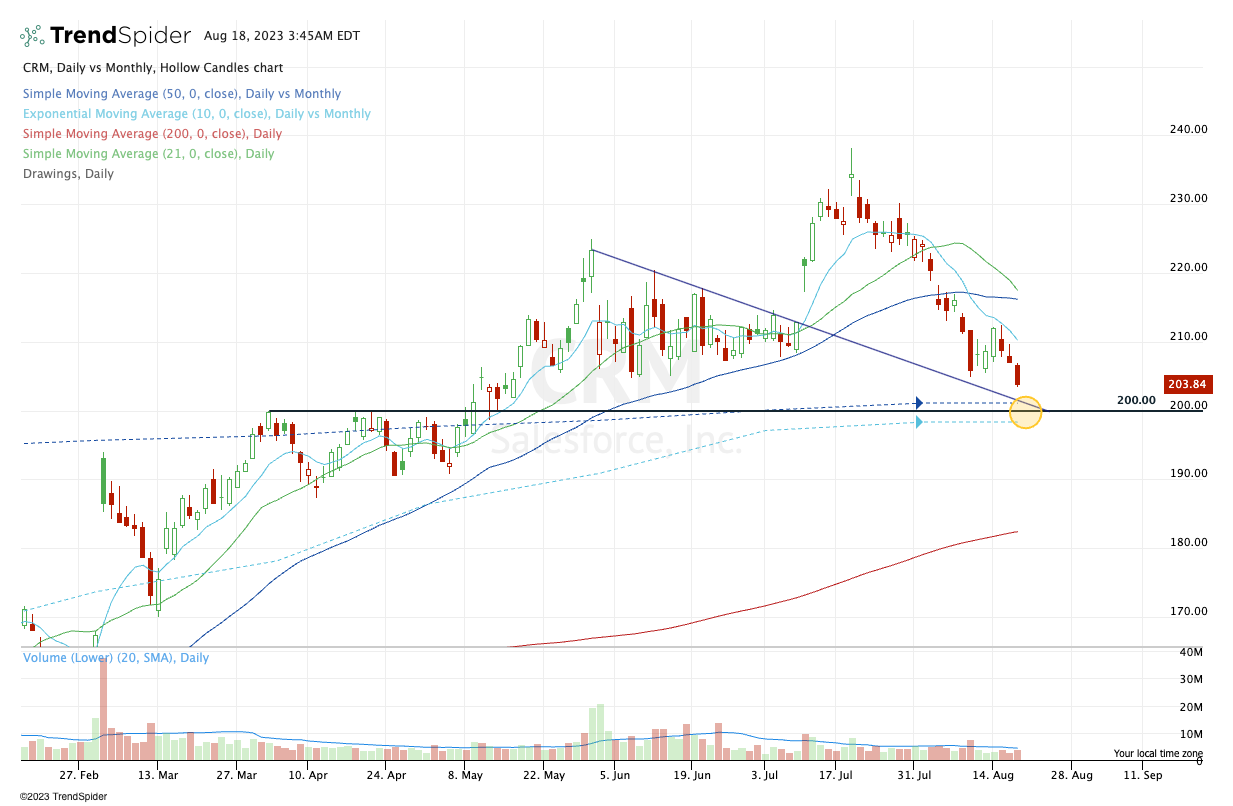
Here’s why I’m looking for a long position in CRM. Should we see it, September or October calls or call spreads could be an option. Specifically, I’ll be looking at the $210 calls if we see the ~$200 area.
Calls are great, because our max risk is simply price paid. If you don’t want to risk more than $X on the trade, don’t spend more than $X on the calls.
Open Positions
Bold are the trades with recent updates.
Italics show means the trade is closed.
Any positions that get down to ¼ or less (AKA runners) are removed from the list below and left up to you to manage. My only suggestion would be B/E or better stops.)
** = previous trade setup we are stalking.
XXXXXXXXXXXXXXXXXXXXXXXXXXXXXXXXXXXXXXXXXXXXXXXXXXXXXXXXXX
Let’s be grateful that we had 5+ months of excellent trades and then came into this correction with relatively low exposure, B/E stops and partial positions.
Down to Runners in GE, CAH, LLY, ABBV, AAPL, MCD & BRK.B. Now Add META, AVGO, UBER, CRM, AMZN, CVS, AMD, TLT (several times) and YM.
JPM — Many are long from $143-145. This is a longer term swing. Trimmed $153s, then $157.50+ on 7/24.
Down to ½ position vs. Break-even stop. Can make small, ~10% position trim if we see $160+
Consider a stop-out so we can reload in the low-$140s if JPM falls that far.
ARKK — Long from ~$46 — trimmed near/at $50. Still carrying ⅔ to ¾ of position. Trim at ~$52. Can’t hold $42.75. Cut.
Added back about ⅓ of our position around $45.50. Keep in mind, there could be room down to the 50-day moving average.
XOM — long from the monthly-up area at $108.50 — First ¼ or ⅓ trim is ~$112.50. Stops at $104.
**CRM — Would still love to see a dip down to the low-$200
**UNH — Nixed — too sloppy after yesterday’s trade.
Go-To Watchlist
*Feel free to build your own trades off these relative strength leaders*
Relative strength leaders →
LLY
Energy stocks — VLO, SLB, EOG
AI stocks — NVDA, ADBE
Mega cap tech — GOOGL, AMZN
Select retail — ELF, LULU, COST
BRK.B (new all-time highs)
CAT
RCL
Relative weakness leaders →
DIS
PYPL
EL, FL, DG


