Back-to-Back Strong Breadth Has Bulls in Control
But cross-currents continue to muddy the waters
Technical Edge —
NYSE Breadth: 95% Upside Volume (!!)
NASDAQ Breadth: 91% Upside Volume (!!)
VIX: ~$29.50
If you missed it yesterday, here was a recent setups list for individual stocks.
Game Plan: S&P, Nasdaq, Bonds
We’re trying to balance the “Big Picture” and the day-to-day action.
For instance, the dollar is up and bonds are down this morning (the latter, bonds, are a bit concerning in general but more on that in a minute).
However, the market just gave us two very, very robust days of upside breadth, with an 88.9% upside day on Monday and a 95% upside day on Tuesday.
Advance/decliners were 82.8% and 86.2%, respectively.
I would have preferred a 90/90 day in there, but back-to-back 80/80 days is impressive. For what it’s worth, 90/90 days tend to foreshadow much larger rallies.
Still though, this has me wondering if this low could be the low for a while. Even if it gets retested, could this rally have legs for a while?
S&P 500 — ES
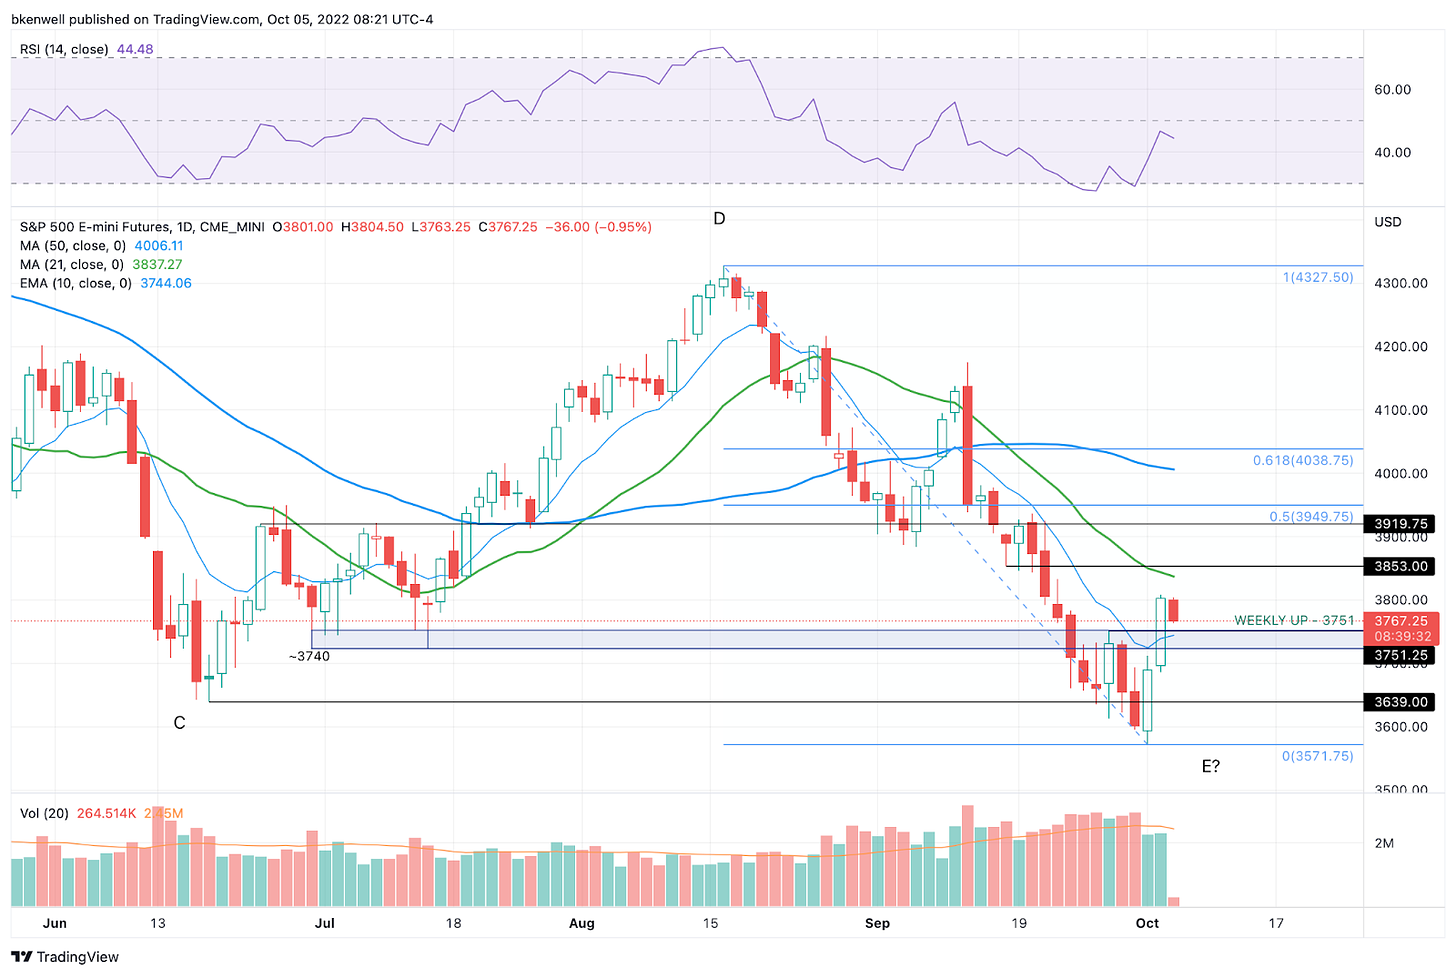
We noted a cash flow trade yesterday that didn’t come to fruition and said, “Otherwise, if the ES reclaims 3751 and stays above it, it could put another hundred handles in play up to 3850 and the 21-day.”
That could be the course of action from here, with the 10-week looming just a bit higher beyond 3850.
Down about 38 handles this morning, we finally have a dip to work with. Bulls want to see support from the 3740 to 3750 area. There we have a ton of measures to note:
The 50% retrace of yesterday’s range
10-day moving average
Last week’s high
Prior support from July turned resistance in September and reclaimed yesterday.
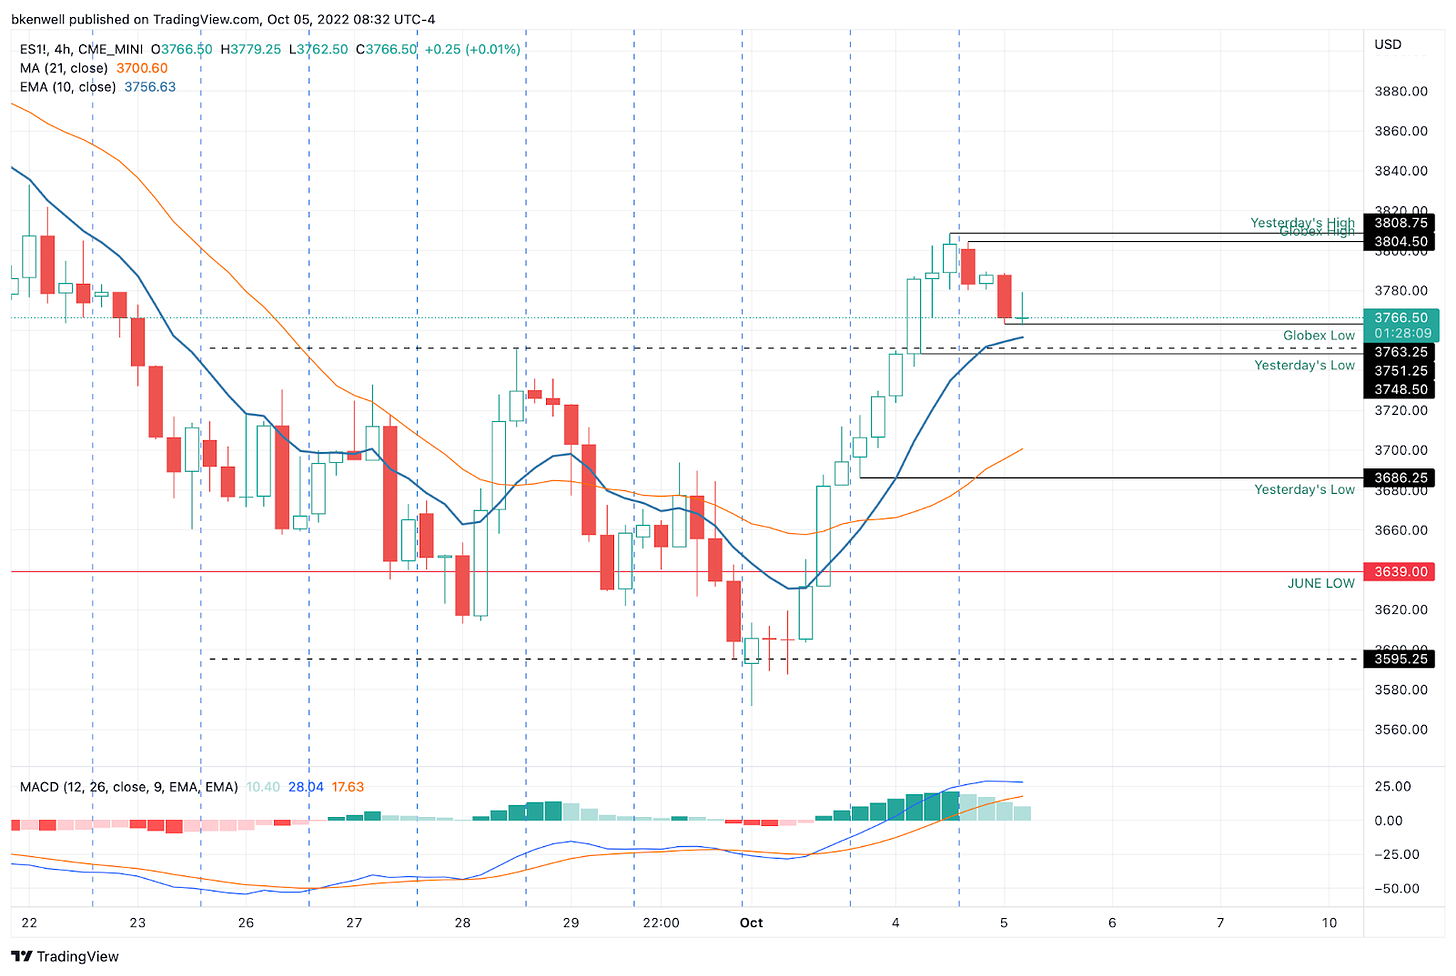
If all of these hold, it’s a buy-able dip for the bulls. For what it’s worth, the 10-ema on the H4 chart is also in play at 3755.
ES — 4H Chart
If it helps for visuals, there’s the H4 chart above.
SPY
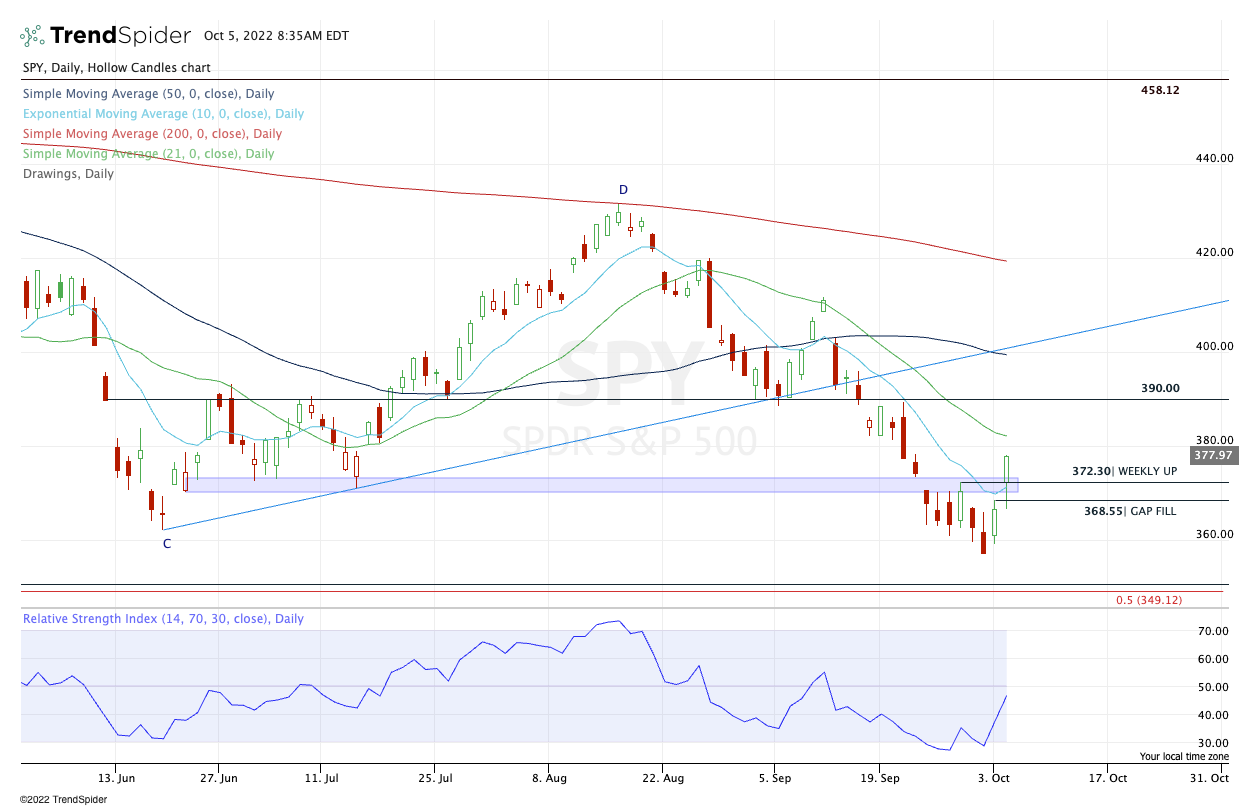
I want to see the $370 to $372 area hold as support — and closer to $372. If lost, we have an open gap on the chart (even though it doesn’t show on the daily) at $368.55.
Over $372.30 remains bullish to my eye.
Bonds — TLT
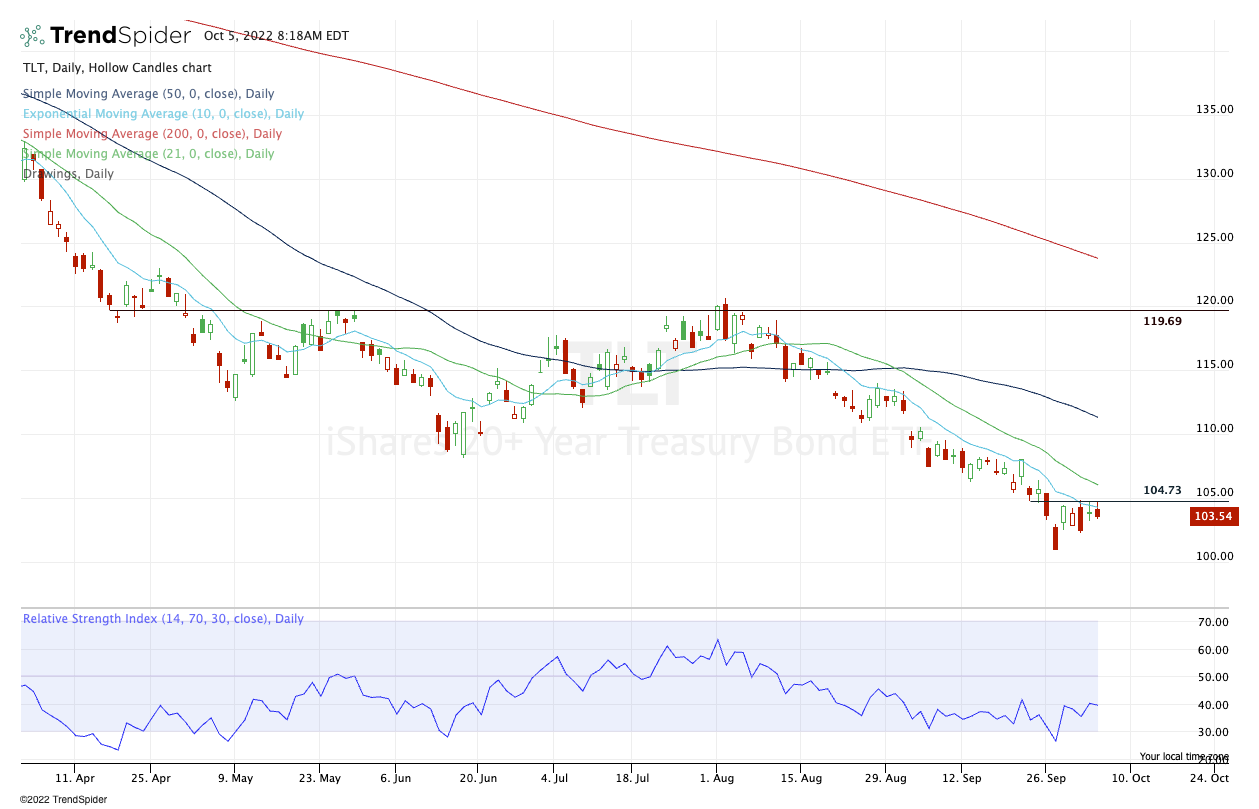
Premium members who have been here for more than a few months know the bonds have been a concern for me, specifically since Aug 8. They are often a canary in the coal mine.
The SPX enjoyed a big rally yesterday, fueled by the decline in the dollar. But the bonds didn’t participate, falling 28 basis points.
The TLT has been stuck below $105 and is now trading just under $103 in the pre-market.
If this rolls over and if the dollar bounces further, stocks could struggle IMO. While stocks could also break their correlation to these assets, they haven't yet.
Go-To Watchlist
*Feel free to build your own trades off these relative strength leaders*
Numbered are the ones I’m watching most closely.
Bold are the trades with recent updates.
Italics show means the trade is closed.
Notes:
MCK — weekly-up triggered from our buy list. $360 is first target area.
Relative strength leaders →
Top:
ENPH — holding the breakout near $269 — Great Setup
LNG — nearing the breakout near $150 — Monster Reaction
MCK — holding the breakout near $340
CAH — holding the breakout near $64
Here’s a quick look at the stocks above.
FSLR
ALB
VRTX
CYTK
CELH


