

Can Stocks Rally on Opex Day?
"Risk-on" trades keep trying to rally, too.

Good morning! If you have not seen the latest S&P video, please feel free to take a few minutes and check it out or view it this weekend. Good luck today!
Technical Edge —
NYSE Breadth: 59% Upside Volume
NASDAQ Breadth: 61% Upside Volume
VIX: ~$28.50
Following a 90% downside day, the market just couldn’t gain any traction…for either side!
At one moment you look at the screen and ARKK is up 6% while AAPL is down 2% and the Nasdaq is mixed. Then it looks like it wants to rally but loses steam. So it starts to break down, but then in come the bids.
It was a back-and-forth slopfest, but the chop was tradeable if that’s part of your style. I had an appointment and missed the second half of the day and after looking at the final 4 hours, I’m glad that was the case.
Game Plan — S&P (ES and SPY), Nasdaq (NQ and QQQ), Individual Stocks
The ES is currently down ~2% for the week as it bounces during Globex, while the index is down 3%.
We have gone over the statistics already, but only once in the last 30 years have we seen the S&P fall for seven straight weeks. The index is also off 18.2% so far this year, its worst start since 1940.


The silver lining for bulls is that in situations like this where the losses eclipse 15%, the S&P has rallied nicely into year-end (and 3 out of the 4 occasions, by double-digits). Of course, that doesn’t mean it will happen this time, but it’s something to think about.
S&P 500 — ES
It’s not simple, but the ES levels are fairly straight-forward.
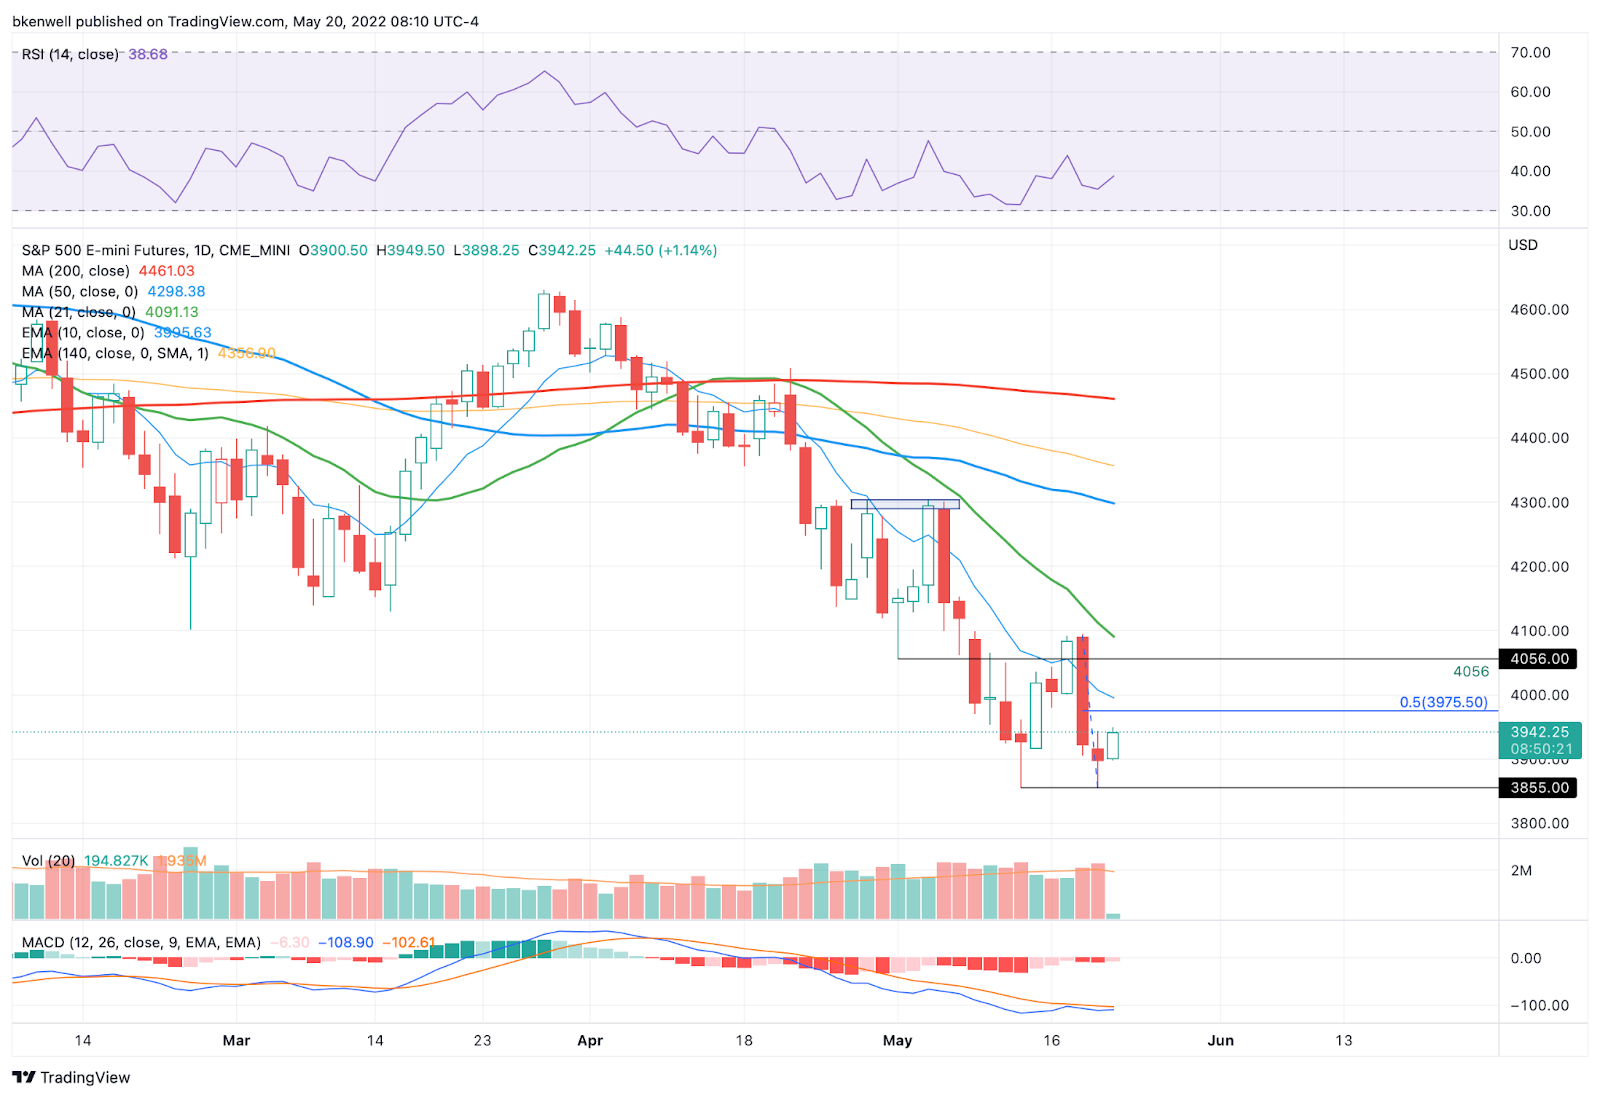
On the upside, the ES needs to clear Thursday’s high of 3943.50. That opens the door to the 3975 level, the 50% retrace of this week’s range. Above 3975 puts 3990 to 4000 on the table.
On the downside, use caution below 3905, Wednesday’s 90% downside-day low. Below that and the 3855 area is in play, where we find this week and last week’s low.
SPY

On the upside, watch yesterday’s high at $394.14. Above that opens the door up to the $397 level, potentially followed by a push toward $400.
On the downside, below $390.55 is a cause for caution. Below Thursday’s low at $387.11 opens the door down to the low at $385.
Nasdaq — NQ

With the NQ, I have the two-week high and two-week low highlighted on the chart with black lines.
A break of either one of those levels and failure to trade back within the range could create a continuation trade in the respective direction. On the downside, that could set the stage for 10,700 to 11,000 and on the upside and on the upside, it could put 13,500 on the table.
In the short term, watch yesterday’s high at 12,077. Failure to hold above this level keeps 11,900 in play. However, if it can push above 12,077 and hold strong, bulls could put this up to the 12,225 to 12,250 zone.
Below 11,895 and traders need to be cautious of more downside.
Bonds — ZB
Same setup from yesterday as ZB is still trying for weekly-up over 141.03.
Oil — XLE

Yesterday we had a quick Red-to-Green trade in XLE and let us trim into strength. Let’s see if we can’t get $84+ to trim more or all of this now.
Stop-loss just below yesterday’s LOD or at break-even — whatever fits your tolerance.
Go-To Watchlist
*Feel free to build your own trades off these relative strength leaders*
Numbered are the ones I’m watching most closely. Bold are the trades with recent updates.
AR — Target No. 2 at $36 was hit. → Ideal final target is $38.50 to $39. However, if we lose Wednesday’s low of $34, manage according to your risk tolerance (B/E stop is down near $31, but that’s a lot of profit to cough up).
ABBV — Weekly up → Conservative trim hit. Stopped Out
XOM — this target hit “Above $92+ and feel free to trim as much as you want.”→ B/E stop on the remainder of the position ($89). $96 to $97 is a big extension area if it can really get going.
Relative strength leaders (List is cleaned up and shorter!) →
XLE — A nice run here. Let’s start looking at pullbacks to buy.
AR
PEP
KO
MCK
MRK
BMY
JNJ
DOW
Economic Calendar
