

Can the S&P Continue to Bounce?
We hit a notable support level on Friday, as you know.

Technical Edge —
NYSE Breadth: 27% Upside Volume
Advance/Decline: 28% Advance
VIX: ~$21.75
Last week was messy in the markets, but clean on the charts. Does that make sense? First, 4000 held as support and gave us a bounce. A few days later on Friday we were looking at 3950, “where it should find — at the very least — temporary support.”
It traded 3947.50 and bounced, closing near the 3975 level with 4000 back in play as of 8 a.m. ET.
So what now?
S&P 500 — ES
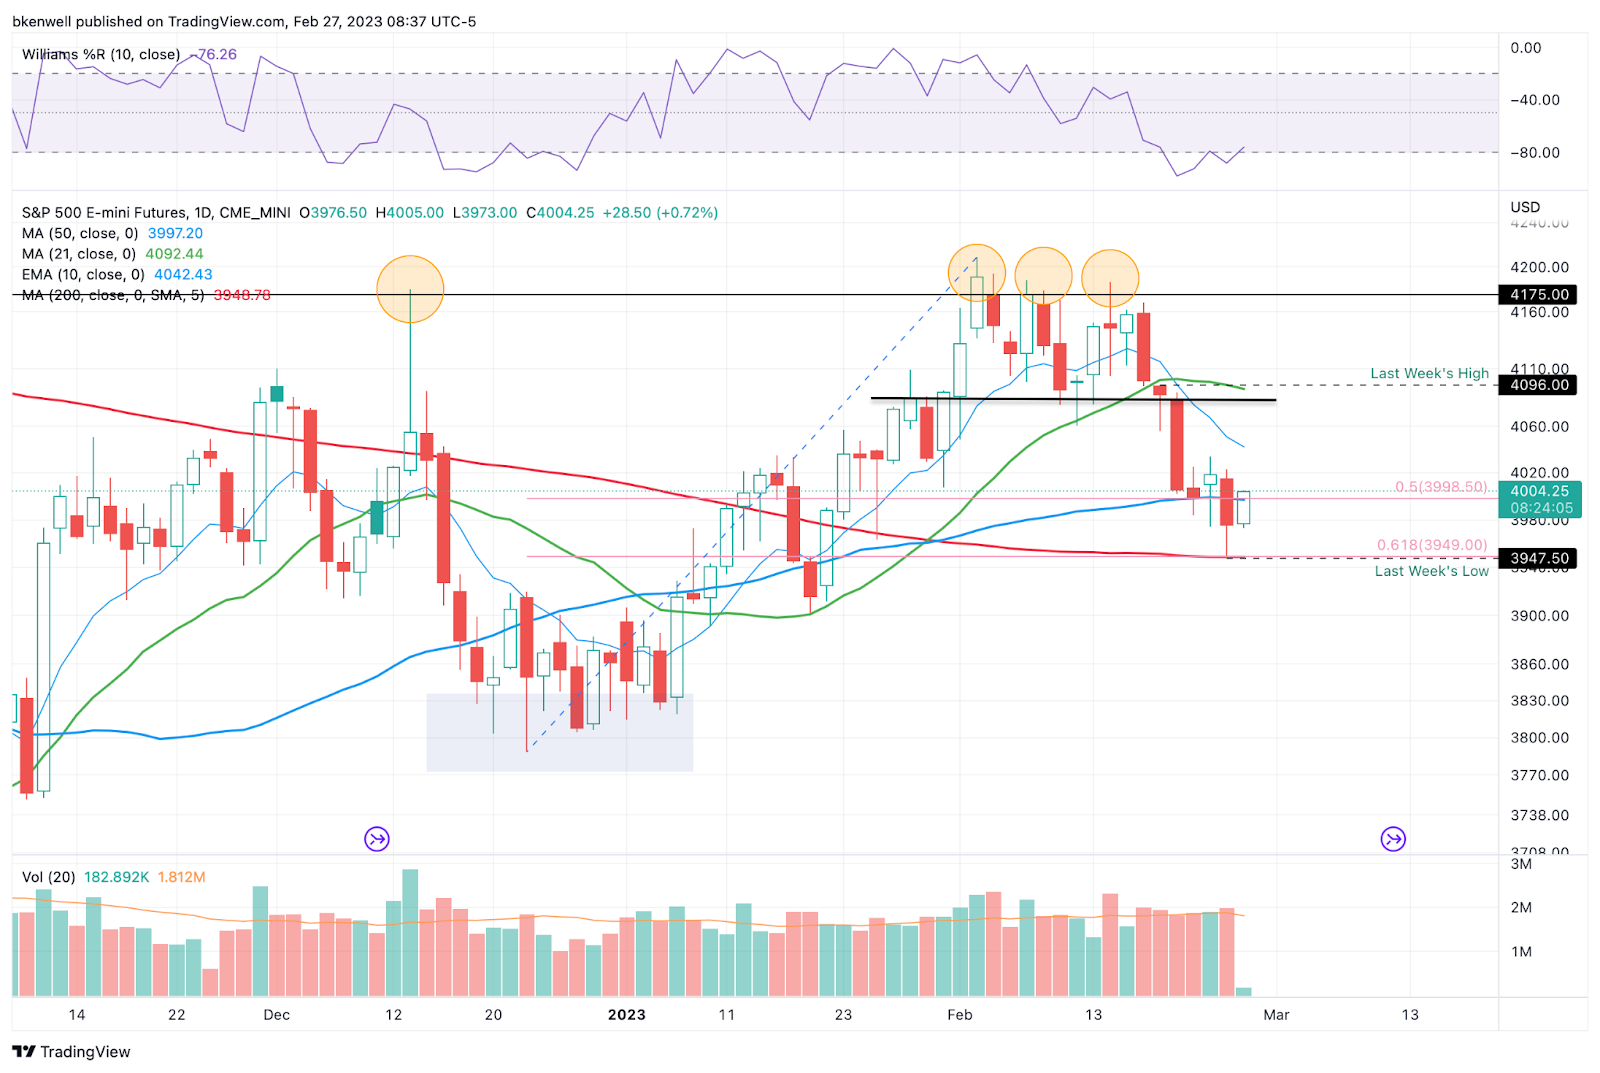
Let’s talk about the bigger picture here for a second. The 4175-ish area held as resistance, despite several attempts to clear this zone.
We’ve lost the 10-day and 21-day moving averages, but are holding some of the bigger MAs (like the 50-day and 200-day). We’ve also now retraced 61.8% of the move from the Dec. lows.
So there are definitely some “concerns” on the chart, although after three straight down weeks and testing a major level, a short-term bounce could certainly be in the cards.
Zooming In
As we take a closer look at the chart, 4020 to 4030 was a notable resistance level last week. I expect this area to be initial resistance if we see it. Above it and the 10-day ema could be in play.
If the ES can’t hold 4000, ~3975 remains in play. If we somehow lose 3973 and can’t regain it, 3950 is back in play.
SPY
Keep reading with a 7-day free trial
Subscribe to Future Blue Chips to keep reading this post and get 7 days of free access to the full post archives.