Technical Edge —
NYSE Breadth: 41% Upside Volume
Advance/Decline: 50% Advance
VIX: ~$20.25
S&P 500 — ES
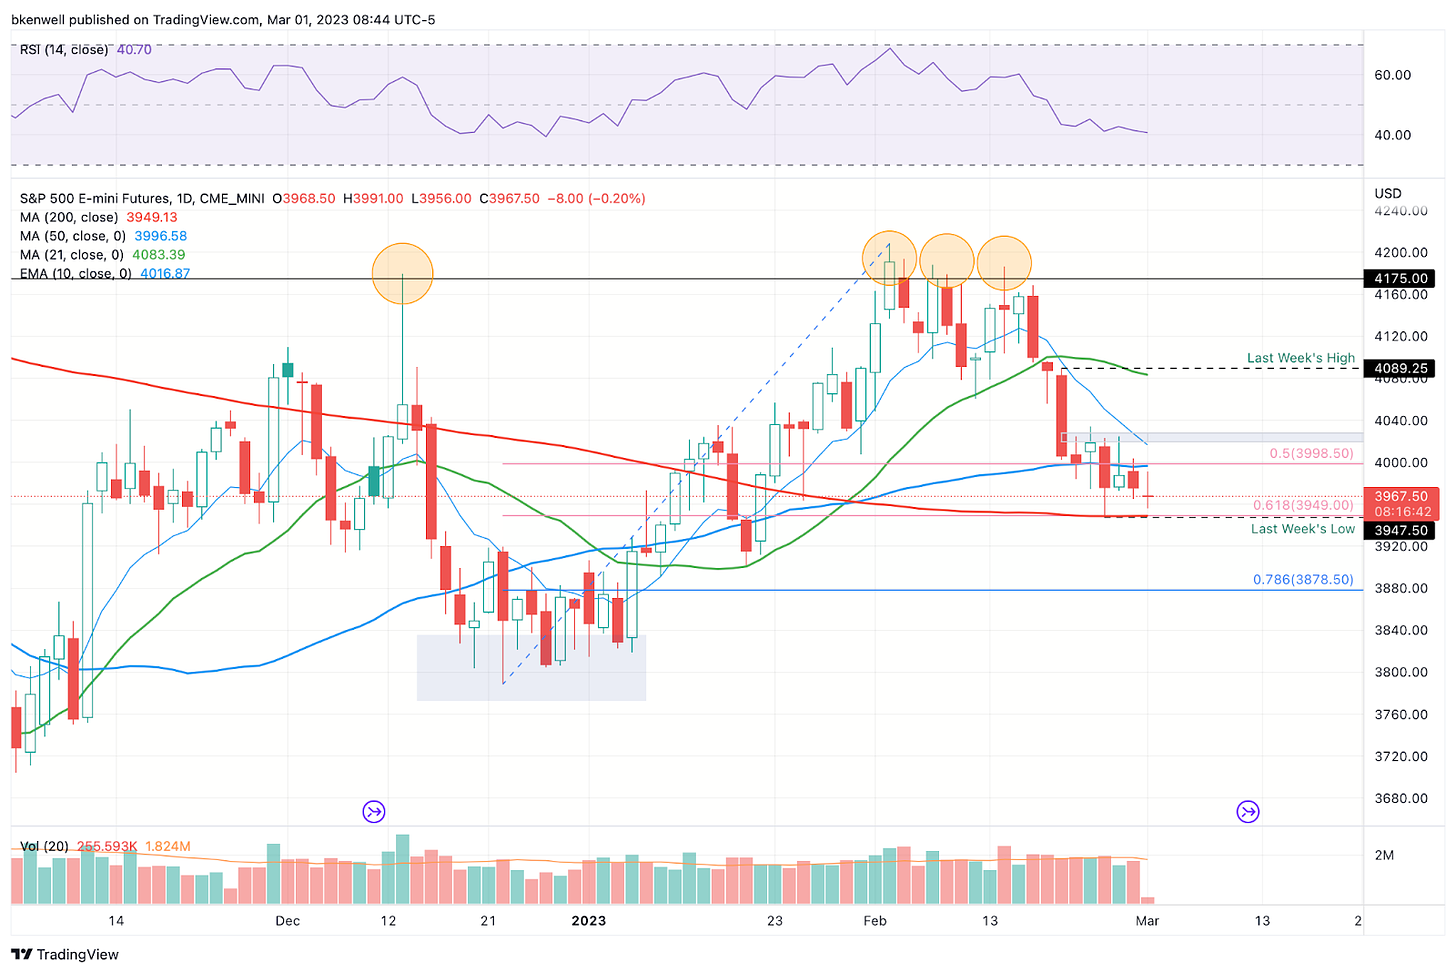
I think we will do a video soon, because the nuances in the ES chart are simply too overwhelming not to talk about them. The trend has been down and the recent strength in the 10-year yield and US dollar is a negative for the S&P.
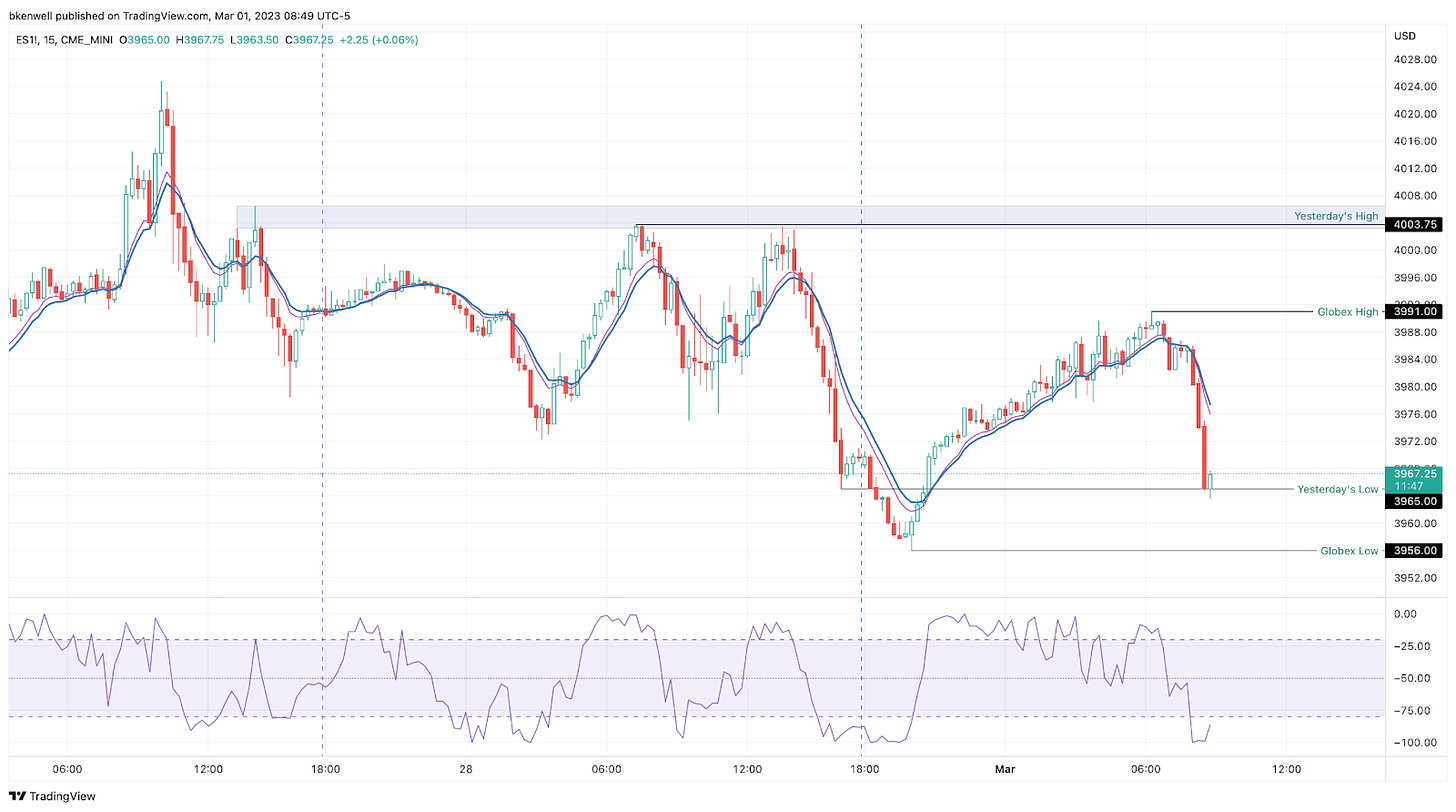
We rallied overnight but were rejected by the 50-day moving average as 4000 becomes a clear resistance level, as shown below on t
Levels: Notice how the ES tagged yesterday’s low of 3965 and reversed. Let’s see if it can hold this area going into the open.
On the upside, watch 3975 to 3980 as possible resistance. Above that puts 3990 in play, followed by a potential push to the 4000-4010 zone.
On the downside, watch 3956, followed by 3947-3950. A break of the latter zone and failure to reclaim it opens the door down to 3920.
Clearly 4000 has been resistance the last two days, while 4030 to 4040 has been resistance for the last week. At some point, we will need to test the declining 10-day ema.
SPY
Keep reading with a 7-day free trial
Subscribe to Future Blue Chips to keep reading this post and get 7 days of free access to the full post archives.


