Technical Edge —
NYSE Breadth: 70% Upside Volume
Advance/Decline: 76% Advance
VIX: ~$27.50
The PPI report came in soft and the market saw a bit of an uptick on that note. And while it is a positive, there are bigger fish to fry right now (not to mention the in-line CPI report from yesterday).
When the VIX rallies 50%+ in two days, bond yields go haywire, gold jumps and the regional banking ETF suffers a peak-to-trough decline of 31% in a week, it will take some time for the system to absorb this extra wave of volatility.
S&P 500 — ES
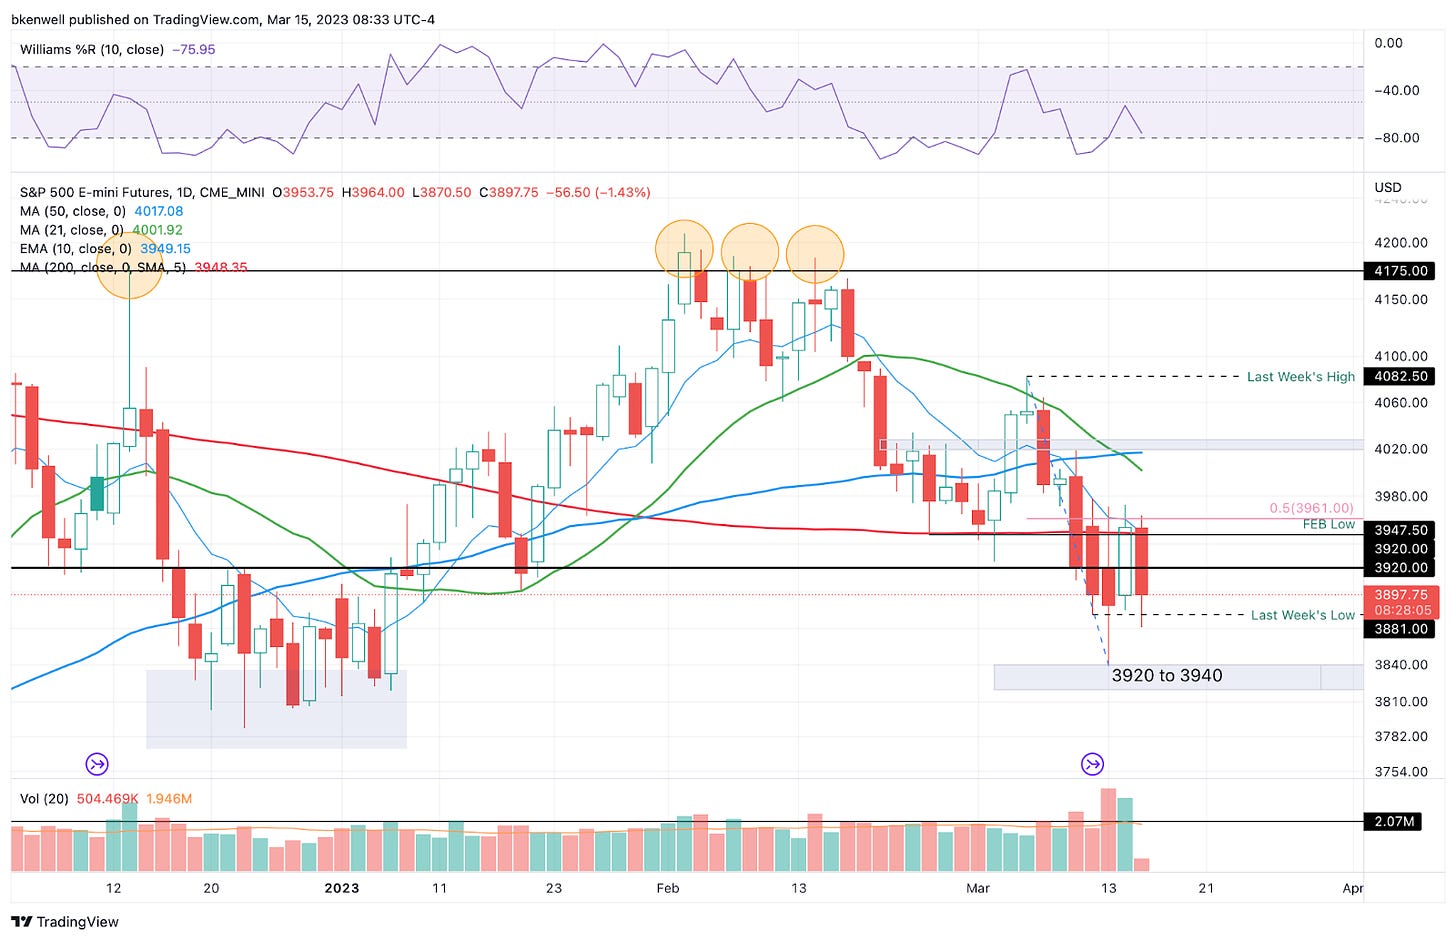
The ES overshot our 3947 to 3960 sell-zone by 10 points, but it was the right location to be a seller. Look, when the VIX is $25+ the ranges are going to be extended a bit.
Of course, no one knew that we’d wake up this morning and European banks would be the problem. But the charts outlined why this was resistance. It was the 50% retracement, 200-day and 10-day moving average and the February low.
Take a moment and observe how much overhead support is now building between 3950 to 3975.
The Trade: 3880 is critical. It’s been support lately and it’s last week’s low. Weekly-down would open the door back down to 3840, (the top of our support zone between 3820 to 3840).
If we lose 3800, 3770 to 3775 is in play — the 61.8% retrace of the rally off the Oct. low.
On the upside, 3910 is resistance. Followed by 3933 and 3950-3970.
SPY
Keep reading with a 7-day free trial
Subscribe to Future Blue Chips to keep reading this post and get 7 days of free access to the full post archives.


