

Cooling CPI Report Doesn't Cool July Rate-Hike Bets

Despite yesterday’s lower-than-expected CPI results — the four main inflation measures all came in below expectations — expectations for the Fed to back off this month’s rate hike haven’t come down.
A day ago, expectations for a 25 basis point rate hike stood at just over 94%. Currently, expectations stand at 92.5%. So a slight downtick, but a pretty near-certain outcome.
On the flip side, 10-year yields (TNX) have come under pressure and are into potential support (charted below). However, that dip was enough to send bonds and our TLT longs higher. Taking some heat off the bonds should help out tech and we’ll see if stocks can finish the week on an upbeat note.
Technical Edge
NYSE Breadth: 70% Upside Volume
Advance/Decline: 70% Advance
VIX: ~$13.50
SPY
Would it be the worst thing in the world to pull back to yesterday’s low of $444.91? Absolutely not.
A dip below the low sends the SPY back into the breakout zone, while a break of the low and a reclaim of that mark (or ~$445) could get bulls involved with a very attractive R/R.
Daily-up unlocks $448.50, then $450-$452.
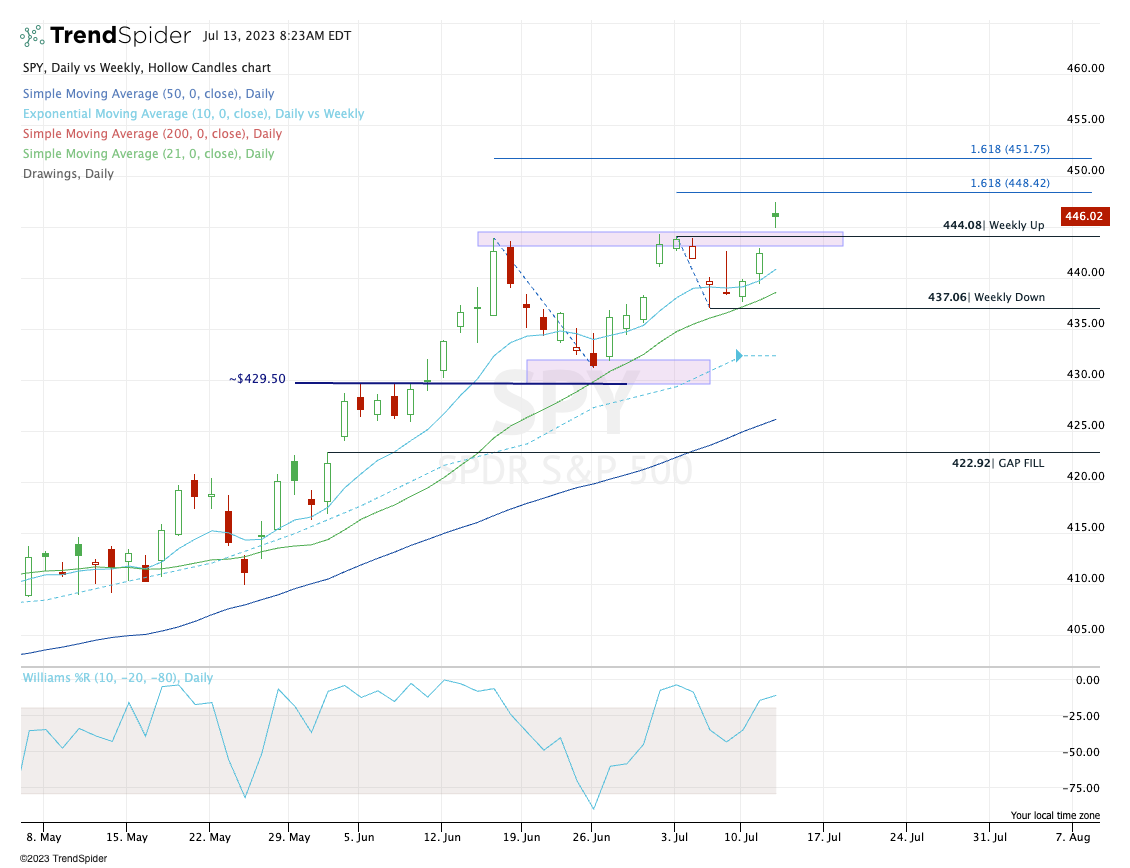
Upside Levels: $448.50, $450, $451.75
Downside Levels: $444-$445, $443 (gap fill)
S&P 500 — ES Futures
The 4-hour chart below highlights why that 4493 to 4503 area is a key zone for bulls to watch.
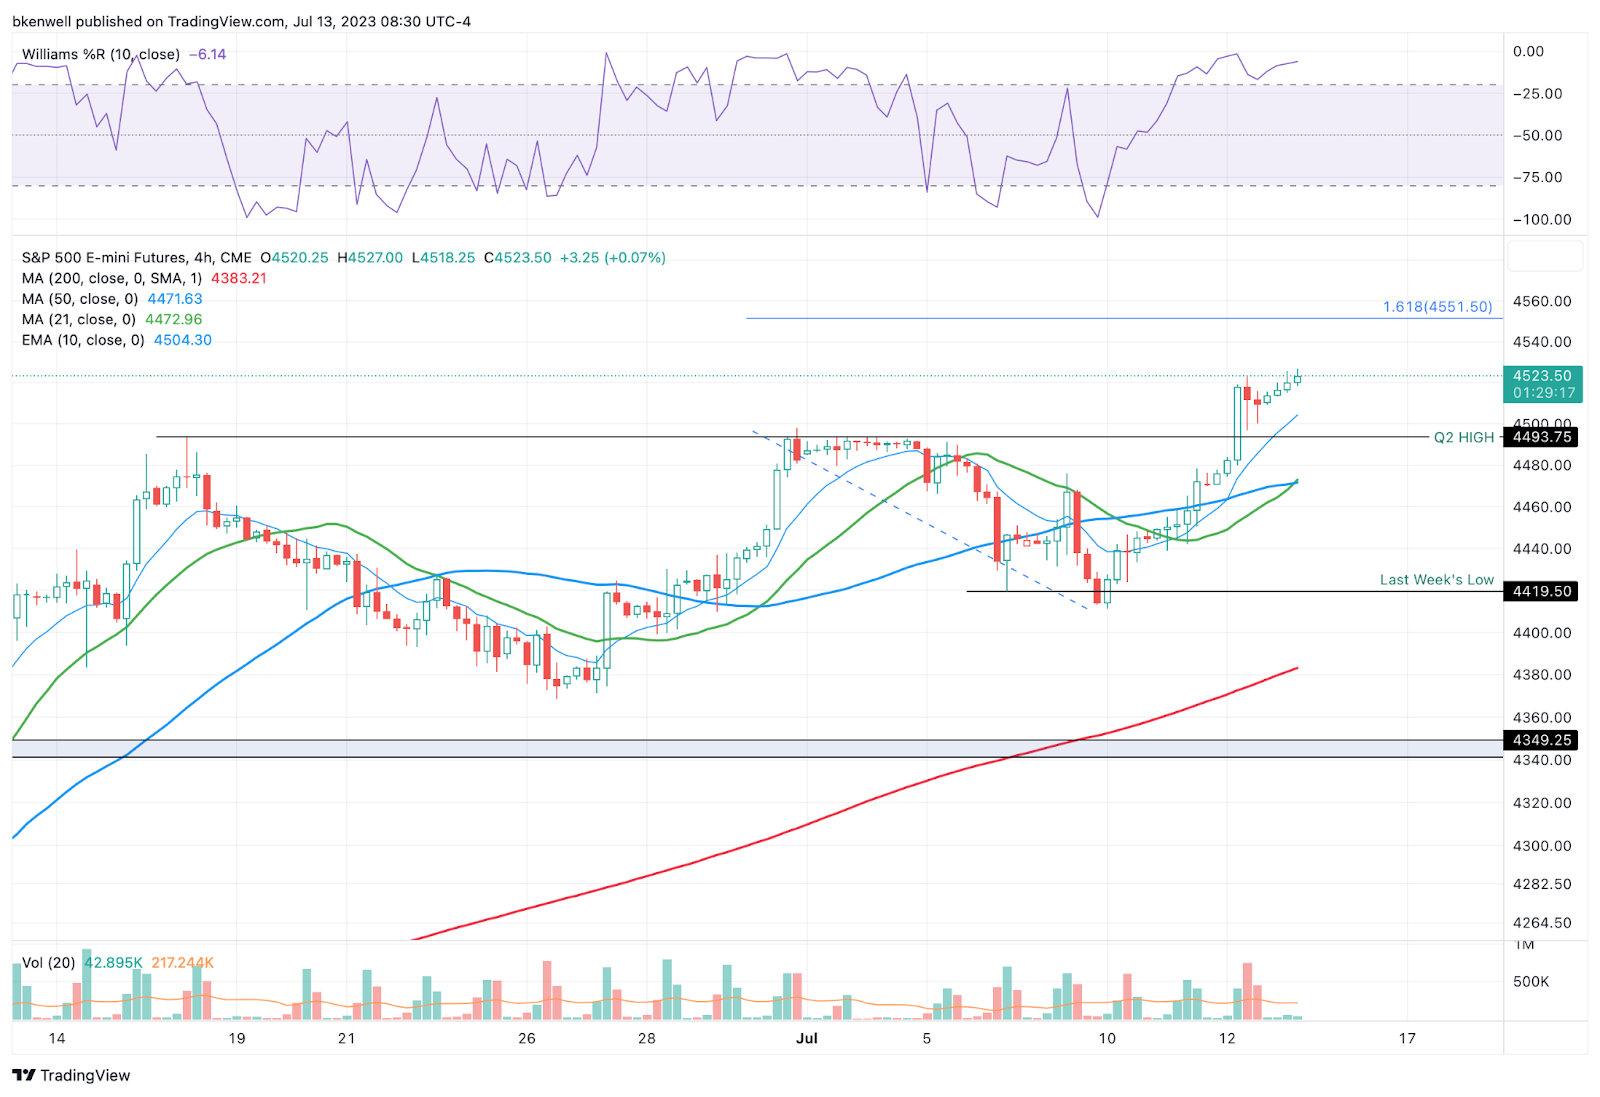
Upside Levels: 4526-30, 4550, 4570
Downside levels: 4493-4503, 4470-75, 4455
SPX (Options)
Upside Levels: 4488, 4500, 4522-25, 4535
Downside Levels: 4463, 4440-50 but 4443.50 specifically, 4423, 4400-05
NQ
Lovely reaction in the NQ. Like the ES, we’re watching the 4-hour chart and the 15,400 to 15,440 area.
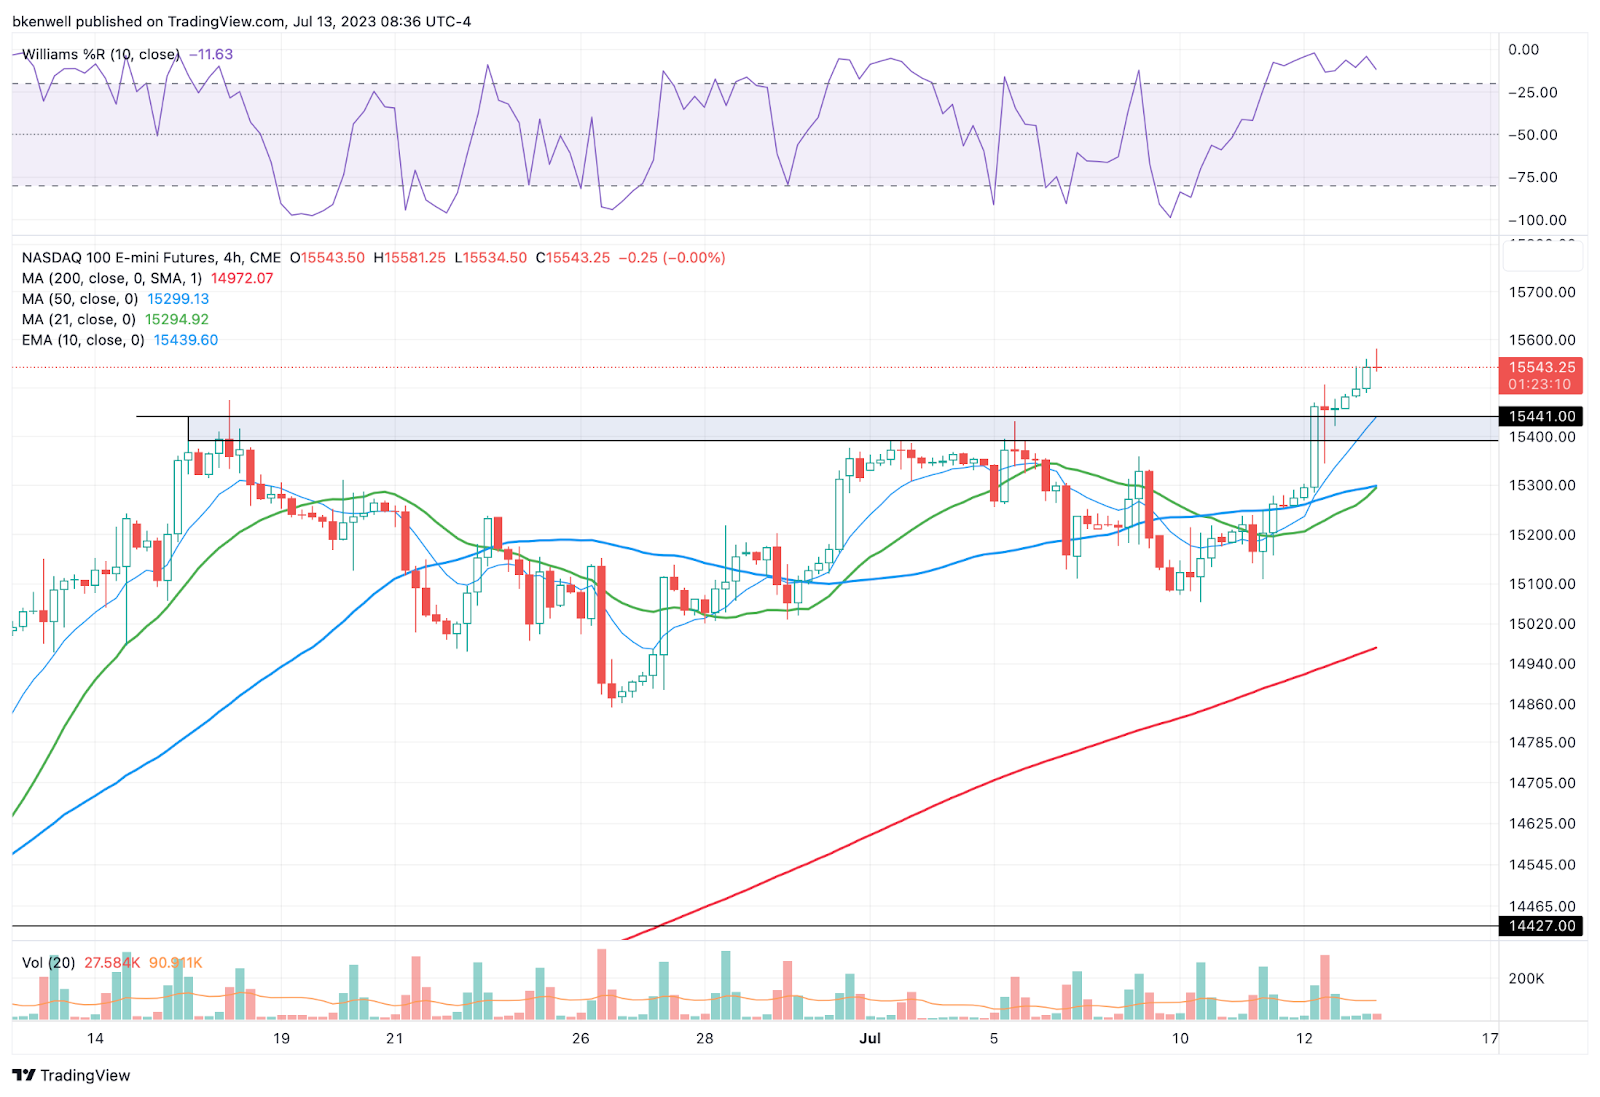
Upside Levels: 15,580-600, 15,560, 15,850
Downside Levels: 15,400-440, 15,370, 15,300-320
QQQ
The Qs seem to be lacking the same “oomph” as the S&P from a technical perspective (not a performance perspective), but given how far it has run, that’s not too surprising.
Keep it simple.
Daily down could get us a gap-fill at $368.63. Daily-up could ignite the move to $377.
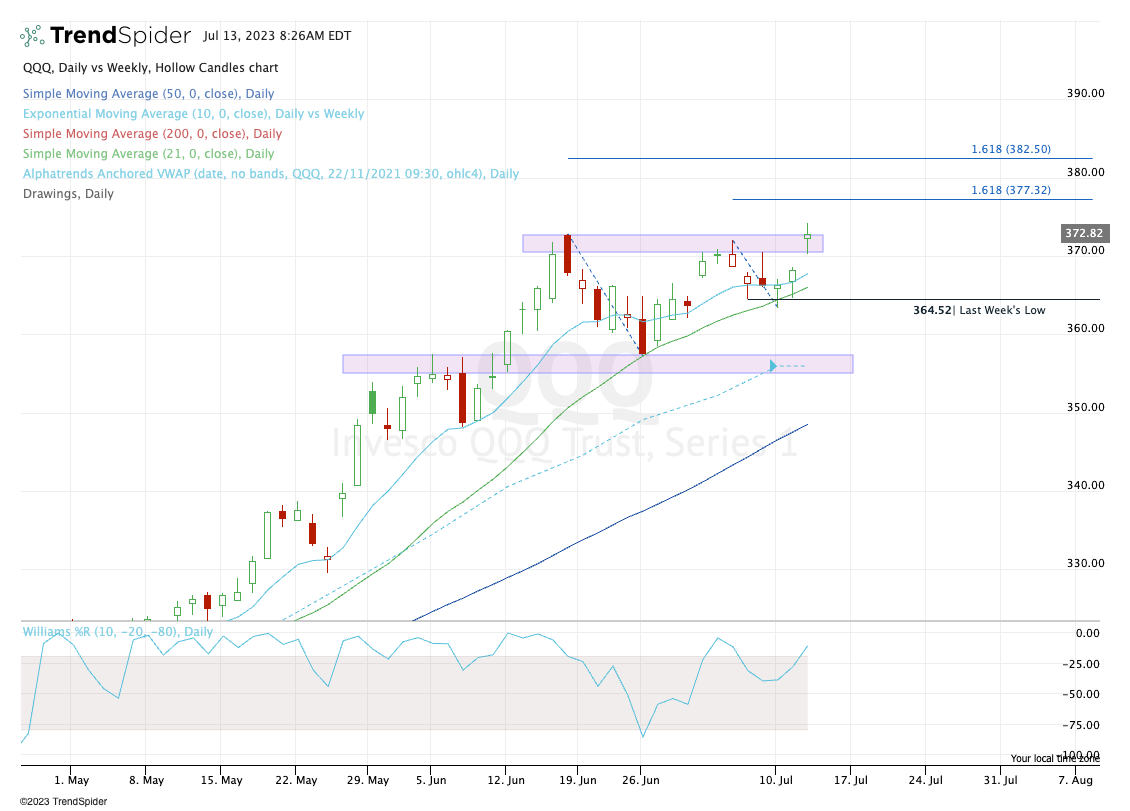
Upside Levels: $375.66 (78.6% retrace of bear market range), $377.25, $380, $382.50
Downside Levels: $370, ~$368.60, $367.50 (61.8% retrace of this week’s rally)
TNX — 10-Year Yields
The dip in yields has taken the heat off bonds, which has given /ZB and our TLT position a nice pop. We’ll see if that develops into something bigger or if it’s just a trade.
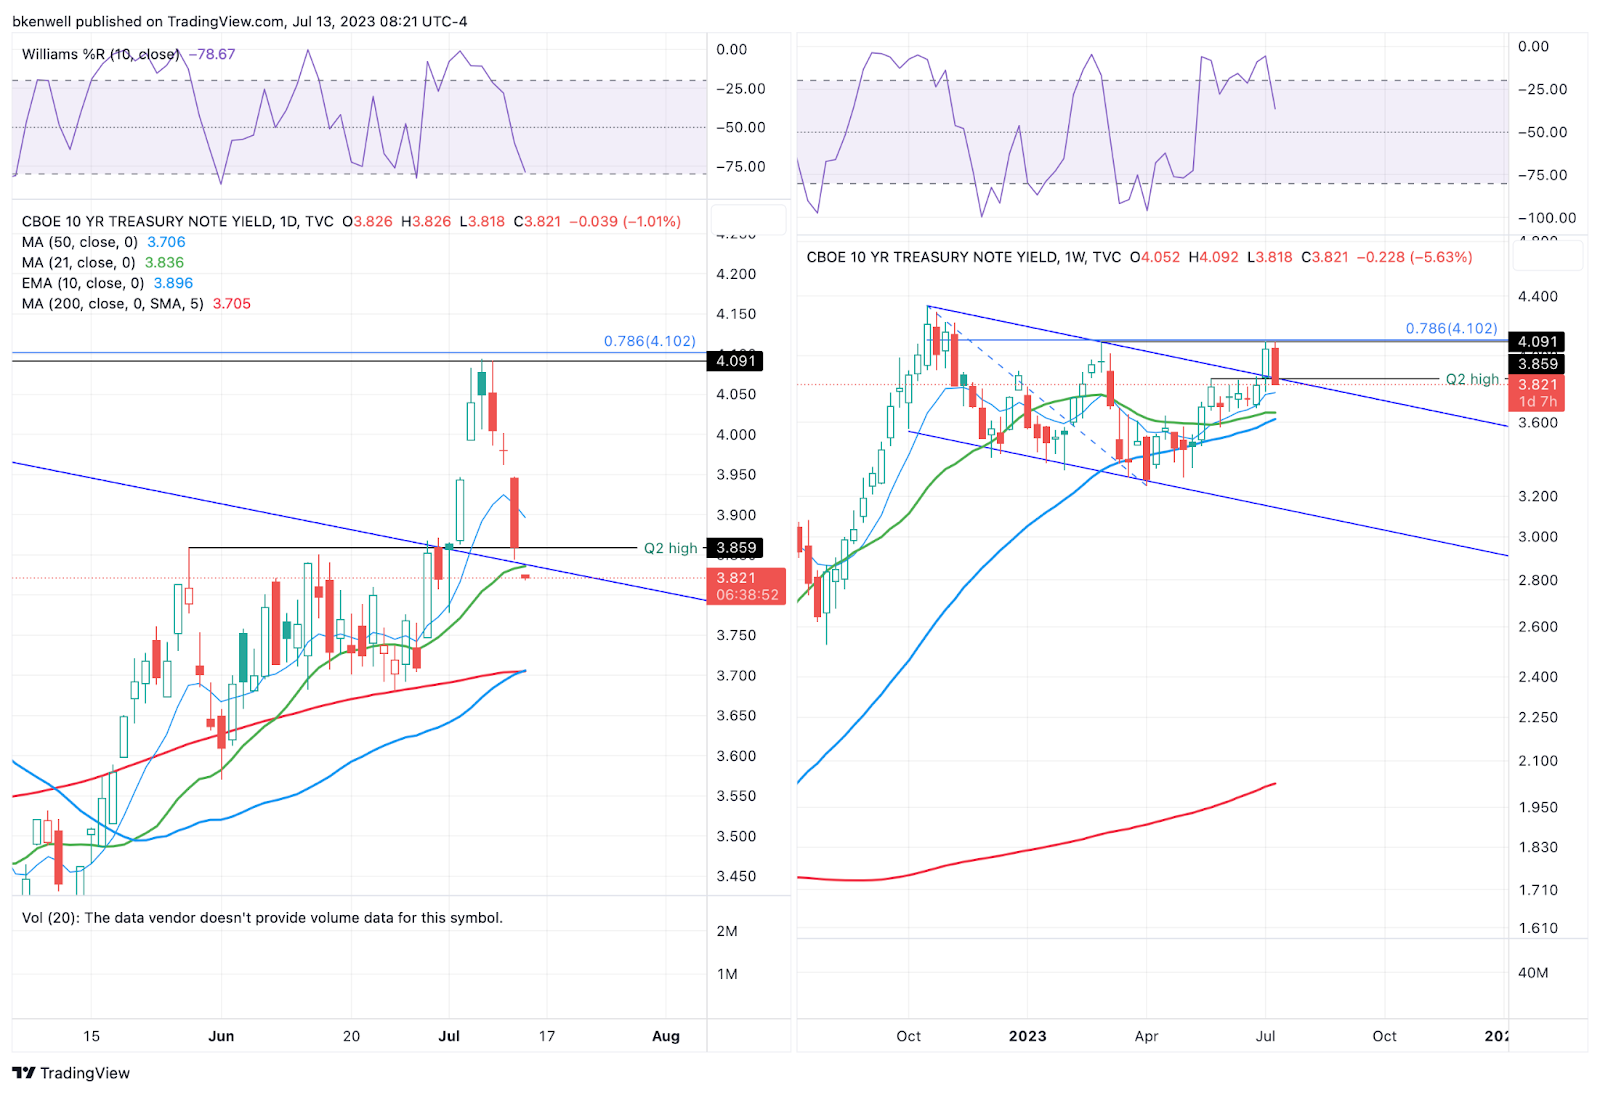
The TNX ripped through the Q2 high, tagged the 4.10 area — which was the 2023 high and the 78.6% retrace — then rolled over.
Can it hold the ~3.85 area, AKA a retest of the Q2 high and the 21-day moving average? If it holds the 10-week (~3.77) bulls could make a case for it to go higher, but really, it needs to stay above 3.86+ to maintain traction.
If it can’t, that bodes well for stocks and bonds.
Open Positions
Keep reading with a 7-day free trial
Subscribe to Future Blue Chips to keep reading this post and get 7 days of free access to the full post archives.