CPI Report: Sigh of Relief, but Can Bulls Harness Control?
Technical Edge
NYSE Breadth: 36.5% Upside Volume
Advance/Decline: 44% Advance
VIX: ~$15.75
The CPI report is going to drive a bulk of the early action today — and maybe all of the action today. We have had a very controlled pullback thus far and despite falling in 6 of the first 7 sessions in August, it’s been a very mild correction from a percentage standpoint.
That’s as the S&P has suffered a peak-to-trough correction of just 3.15% so far.
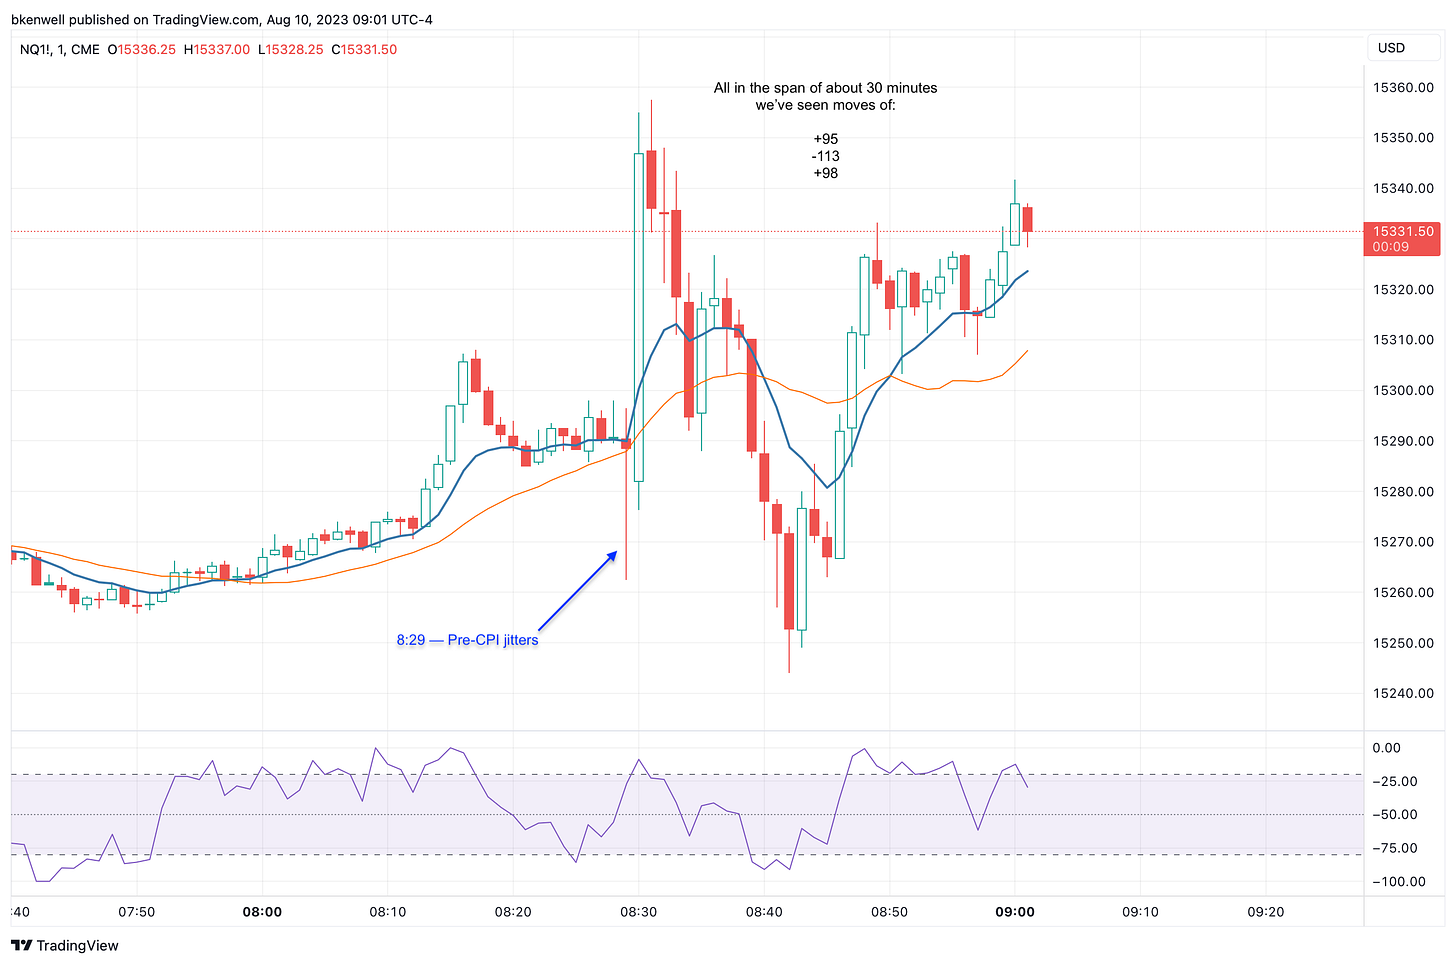
The major categories from the July CPI report were either in-line or below economists’ expectations.
Initially, the reaction was quite bullish (as one might assume), but then the futures rolled back over. Here’s a quick look and mock-up of the NQ:
If we get a continued bullish reaction, we’ll need to see if the rally can “stick,” which happens by clearing and holding above resistance. If we can’t clear resistance and it ends up being another rally to sell, then this correction is not likely over.
SPY — #KISS
Either look for a deeper test of the ~$442 to $443 area on the downside or a push to the $451 to $451.50 area on the upside.
A close back above the 10-day and 21-day moving averages (and thus $451.50) could open the door to $453, then $455.50 (gap fill).
Upside Levels: $451 to $451.50, $453, $455.50
Downside Levels: ~$445, $442 to $443.50
SPX
Upside Levels: 4505, 4520, 4535, 4550, 4567
Downside Levels: 4464, 4450-55, 4425-30, 4400
S&P 500 — ES Futures
I want to avoid the short-term, intraday chart with today’s pre-market events on tap.
A bullish reaction puts ~4540 to test, then the much bigger zone at 4550-60. On the downside, a break below the two-day low thrusts 4470 into play.
Key support: 4493-4503 (but wavering)
Upside Levels: 4540-42, 4550-60, 4575, 4590-92
Downside levels: 4480-82, 4470, 4450-60
NQ
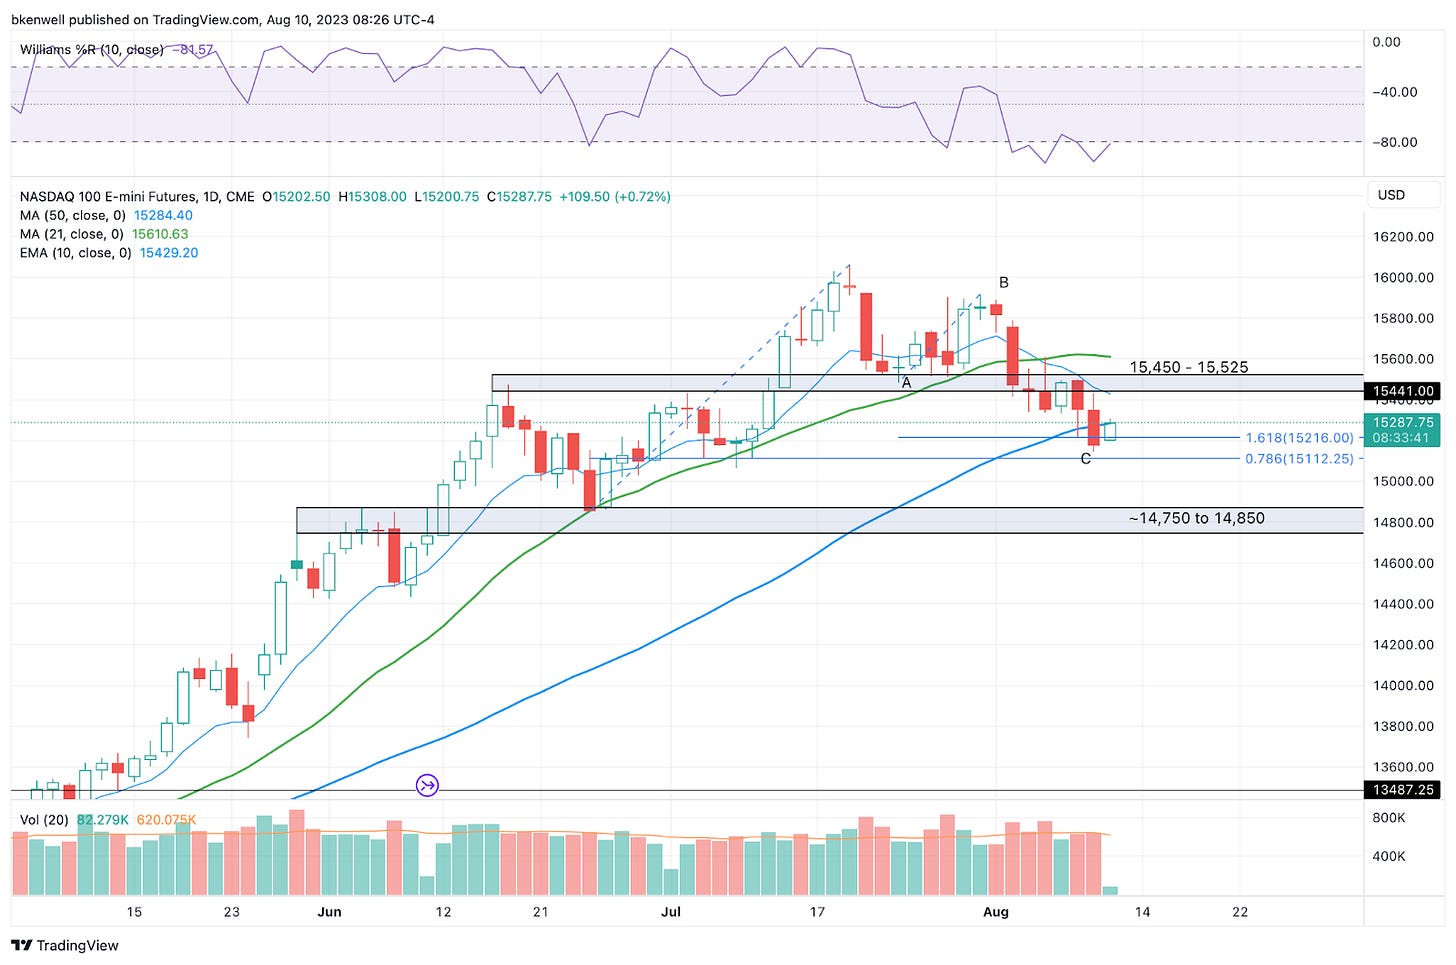
We have been making a living in the 4-hour and 1-hour charts of the NQ for a month now, but like the ES, I want to zoom out a bit and use the daily.
So far, we have a pretty clean “ABC” correction down to the 50-day moving average. If this recent low can hold (at 15,146.50) then bulls will need to see how a test of the 15,450 to 15,525 area is handled.
If the low doesn’t hold, we could see a larger correction down to the 14,750 to 14,850 area. I’m bullish but also of the opinion that a larger shake-out would be healthy over the next month or two.
Upside Levels: 15,350, 15,425-450, 15,525-550, 15,610-625
Downside levels: 15,150, 15,000, 14,750-850 (admittedly a wide range)
QQQ
We had a nice initial reaction off the $369 level on Tuesday, but then more weakness on Friday. If we bounce on the CPI number, longs should consider trimming at the 2-day high near $372.50.
Above the 10-day puts the $375 to $375.50 zone in play to exit more/the rest.
If $367 to $368 doesn’t hold (which would be pretty bearish given the initial CPI reaction is higher), then the $364 zone could be in play.
Open Positions
Keep reading with a 7-day free trial
Subscribe to Future Blue Chips to keep reading this post and get 7 days of free access to the full post archives.


