Early August Weakness in Play?
Some consolidation would be nice

The stock market has been incredibly strong so far this year, with the S&P up about 19.5%. With July in the books, we can say that it officially climbed 138.60 points or 3.1% and hit its highest level since March 2022.
At its July high, the index was less than 5% off its all-time high, while it has now increased its monthly win streak to five straight months, up 21% in that stretch.
All of this to say that, it wouldn’t be the worst thing in the world to see some sort of consolidation or pullback — especially in August and September, two seasonally weak months. In fact, “since 1950, the August-September timeframe has been the weakest two-month stretch for the S&P 500,” according to eToro’s Callie Cox.
That could help set up a larger rally in the seasonally stronger fourth quarter, but we’ll have to see how that plays out.
According to the Stock Trader’s Almanac, “the first trading days of each month combined have produced an outsized share of the market’s overall gains. However, the first trading day of August does not contribute to this phenomenon ranking worst among other First Trading Days in the 2023 Almanac.”
Technical Edge
NYSE Breadth: 76% Upside Volume
Advance/Decline: 70% Advance
VIX: ~$14
Despite the upside breadth shown above — and the Nasdaq breadth was 80% upside volume — the indices finished about flat on the day thanks to a late-day pop.
SPY
Struggled with Friday’s high, even with the late-day rally. Now we have to keep an eye on the $457.70 to $458 area on the upside, and the $456 area on the downside.
If we break yesterday’s $456.05 low, see if it’s quickly reclaimed to give us an upside reversal setup or if it breaks and acts as resistance. If the latter, that sets up some potential for more weakness into the $454s.
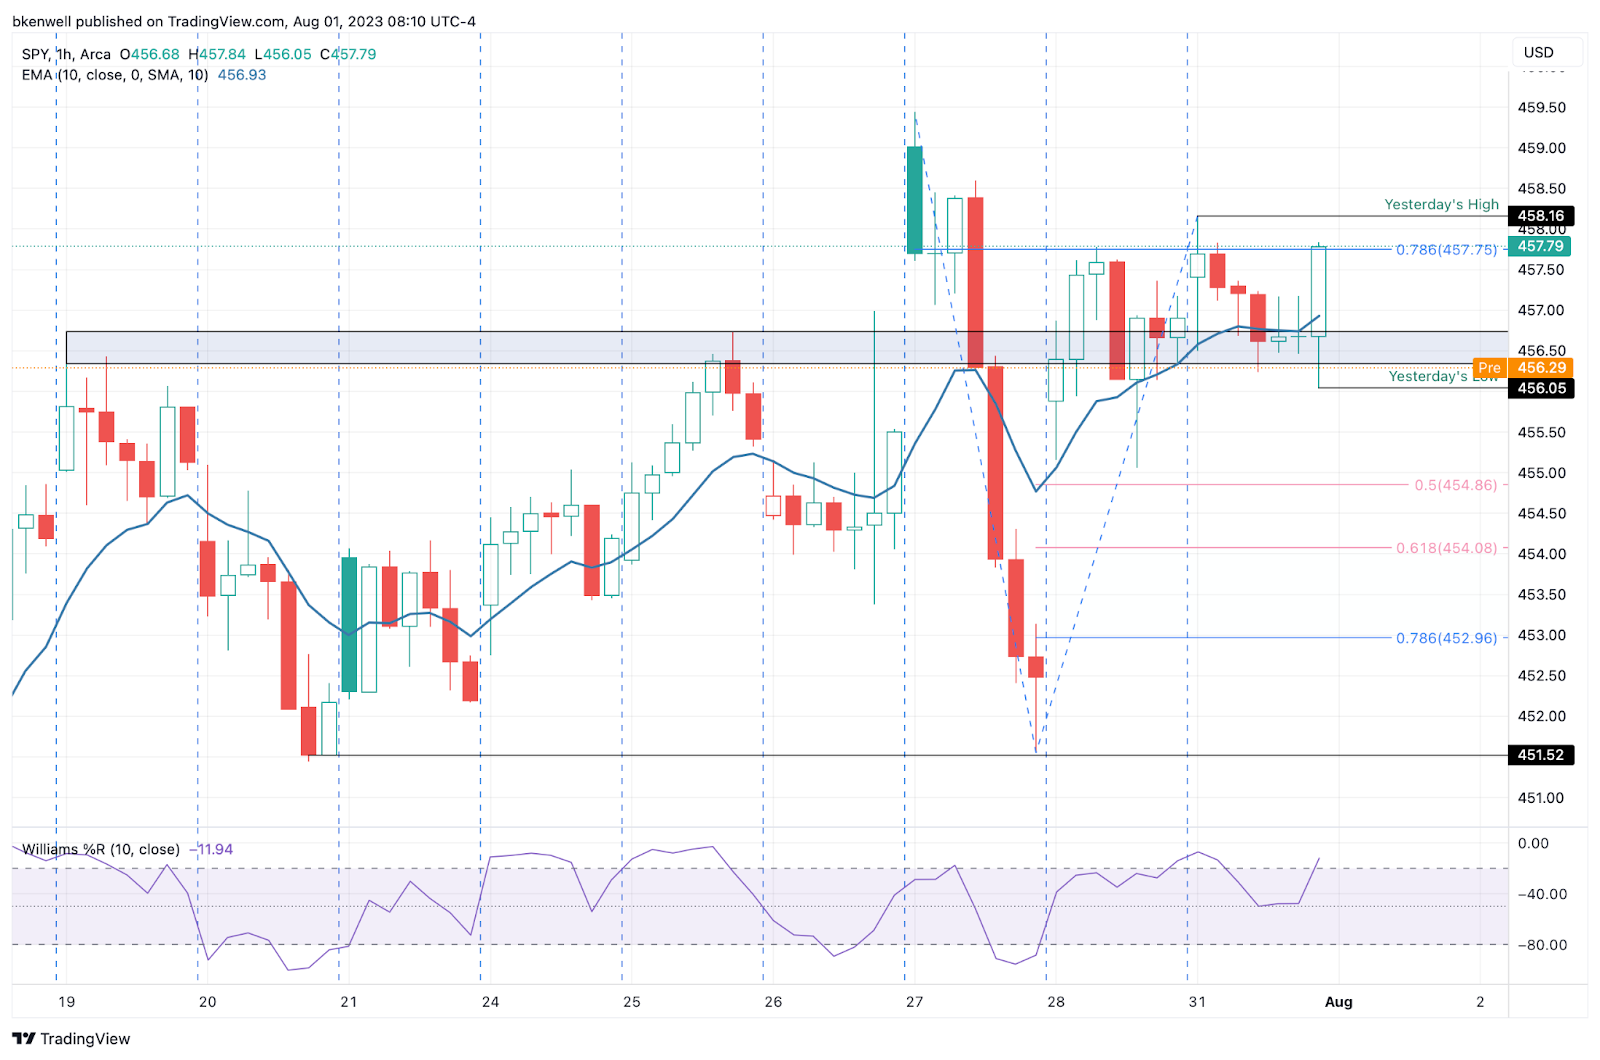
Pivot: $456
Upside Levels: $457.50 to $458, $459.40, $460.35+
Downside Levels: $455, $453, $451.50
SPX
Similar setup to Monday’s chart, but now with a 1-hour look:

Upside Levels: 4590-94, 4605-10, 4625-30
Downside Levels: 4570-73, 4560-65, 4550-53, 4537-42, 4528.50
S&P 500 — ES Futures
While we go intraday on the SPY and SPX, let’s look at the daily chart here. Not sure if it will set up this way, but a dip down to 4580 could be attractive for active traders. That’s the 10-day moving average and the 61.8% retracement of the recent rally.

Upside Levels: 4625, 4634, 4646-50
Downside levels: 4595, 4580, 4571, 4553-58
NQ
Keep reading with a 7-day free trial
Subscribe to Future Blue Chips to keep reading this post and get 7 days of free access to the full post archives.