

Focus Is on Tuesday & Wednesday With Earnings, Fed on Tap
MSFT and GOOGL report Tuesday. The Fed "will" hike on Wednesday.

Friday gave us pretty much what was expected, as the $454s were resistance in the SPY and as tech was weak with earnings, the July expiration and the Nasdaq 100’s special rebalance all in focus.
A slightly deeper dip in the Nasdaq would give bulls a truly juicy R/R dip-buying opportunity (more on that in a moment), although that doesn’t mean it will come to fruition.
Monday is a slow start to the week, as it lacks some of the bigger events that this week holds.
We’ll hear from MSFT, GOOGL and V on Tuesday evening, then on Wednesday we’ll get another 25 basis point rate hike from the Fed. Well, we assume we will anyway, with the market odds currently sitting at 99.8% in favor of a rate hike.
As usual, it’s not what the Fed is doing it’s what it’s going to do — AKA what Fed Chair Powell will say in his press release — which will be what moves markets.
So while today has the potential to be a quiet one, Tuesday and Wednesday are the focus for now.
Technical Edge
NYSE Breadth: 51% Upside Volume
Advance/Decline: 48% Advance
VIX: ~$14.25
No dice on our V setup, although I am still keeping an eye on ARKK this week with tech in the earnings spotlight (shown again below).
SPY
The $454s held as resistance on Friday, as the SPY was unable to break through this area. Now turning the page to Monday, we have a little strength in pre-market trading. Will it turn into enough to break through $454?
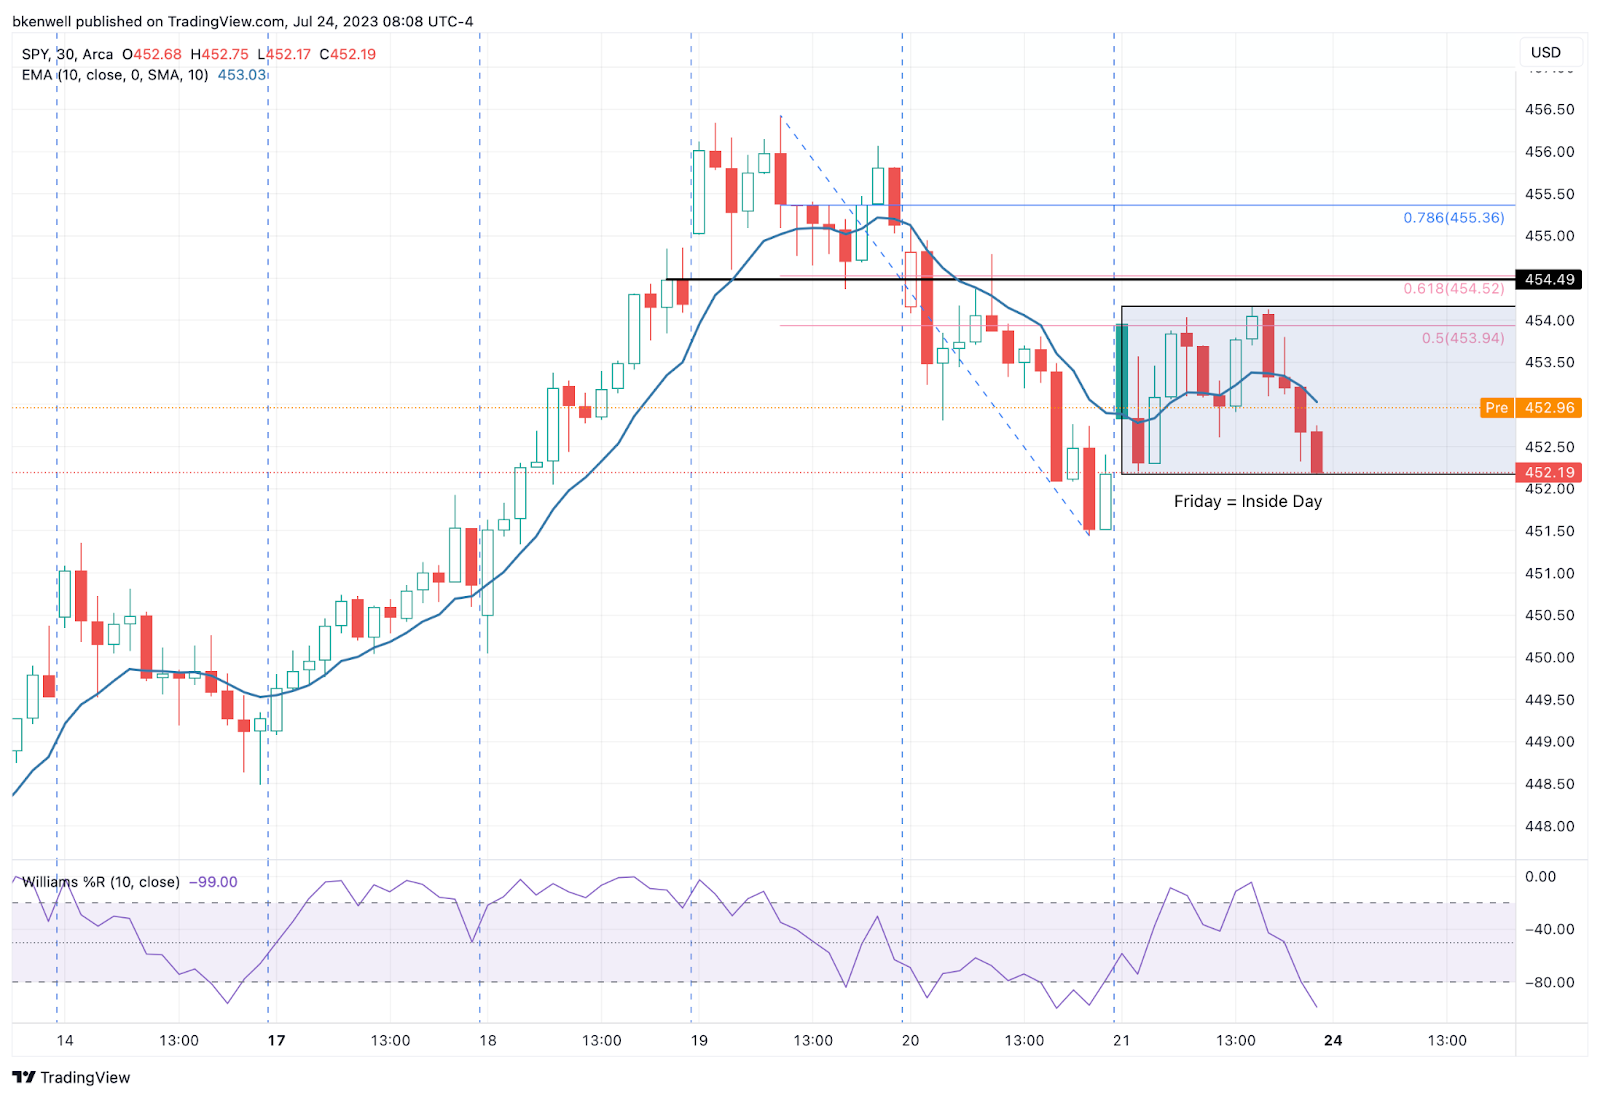
Let’s see if the SPY can push through the $454 to $454.50 area. That would put $455.35 in play, then $456+
On the downside, a break of the Friday’s low at $452.17 could put a test of the 10-day moving average in play near $450:
Upside Levels: $454 to $454.50, $455.35, 456.50, $459
Downside Levels: $451.50 to $452, ~$450 + 10-day ema
S&P 500 — ES Futures
30-min chart shows how the ES has been making lower highs since Wednesday. Can it snap that streak today?
It will need to clear the 4577 area to do so, putting 4580-83 resistance in play, then 4590, 4598-4600, then the highs up at 4609.
On the downside, 4557-62 has been three-day support. A break of that area could usher in a test of the 10-day ema, currently down at ~4545.

Pivot: 4577
Upside Levels: 4580-82, 4590, 4598-4600, 4610
Downside levels: 4557-62, 4545/10-day ema, 4530-33
SPX
Upside Levels: 4555, 4567.50, 4578-80, 4595-4600
Downside Levels: 4536, 4527.50, 4505-10
Nasdaq — NQ and QQQ
Keep reading with a 7-day free trial
Subscribe to Future Blue Chips to keep reading this post and get 7 days of free access to the full post archives.