

Market Caps Matter
On the plus side, we have setups to watch in MSFT and TSLA.

Technical Edge
NYSE Breadth: 63% Upside Volume
Advance/Decline: 48% Advance
VIX: ~$14.25
Traded a recent low of $12.73. That’s the lowest it’s traded since pre-pandemic in early 2020 (i.e. with stocks at ATHs)
Yesterday the S&P fell 0.45%, while the Nasdaq fell more than 1%. However, we had ~50/50 upside breadth on the Nasdaq and more than 60% upside breadth on the NYSE.
In other words, most of the market did pretty well on the day — except mega-cap tech.
Mega-cap tech has been the main driver for US index gains so far this year. However, FAANG + MSFT, NVDA and TSLA all fell yesterday. In fact, of that group, Apple was the best performer with a 0.76% decline.
It’s the only name of those 8 stocks — which combine for a total market cap of ~$10.8 trillion — that fell less than 1% yesterday, while five components of that group fell by more than 2.25% (and four of them fell by more than 3.25%).
In other words, Market Caps Matter, at least when it comes to the indices.
S&P 500 — ES
While this reset has the potential to unravel, I like the ES inching closer to the 4440-4450 zone. While the 21-day moving average is pushing through this zone now, it contains the prior breakout area and the 78.6% retrace of the rally.
If we get there, odds favor the buyers stepping in — at least for a bounce.
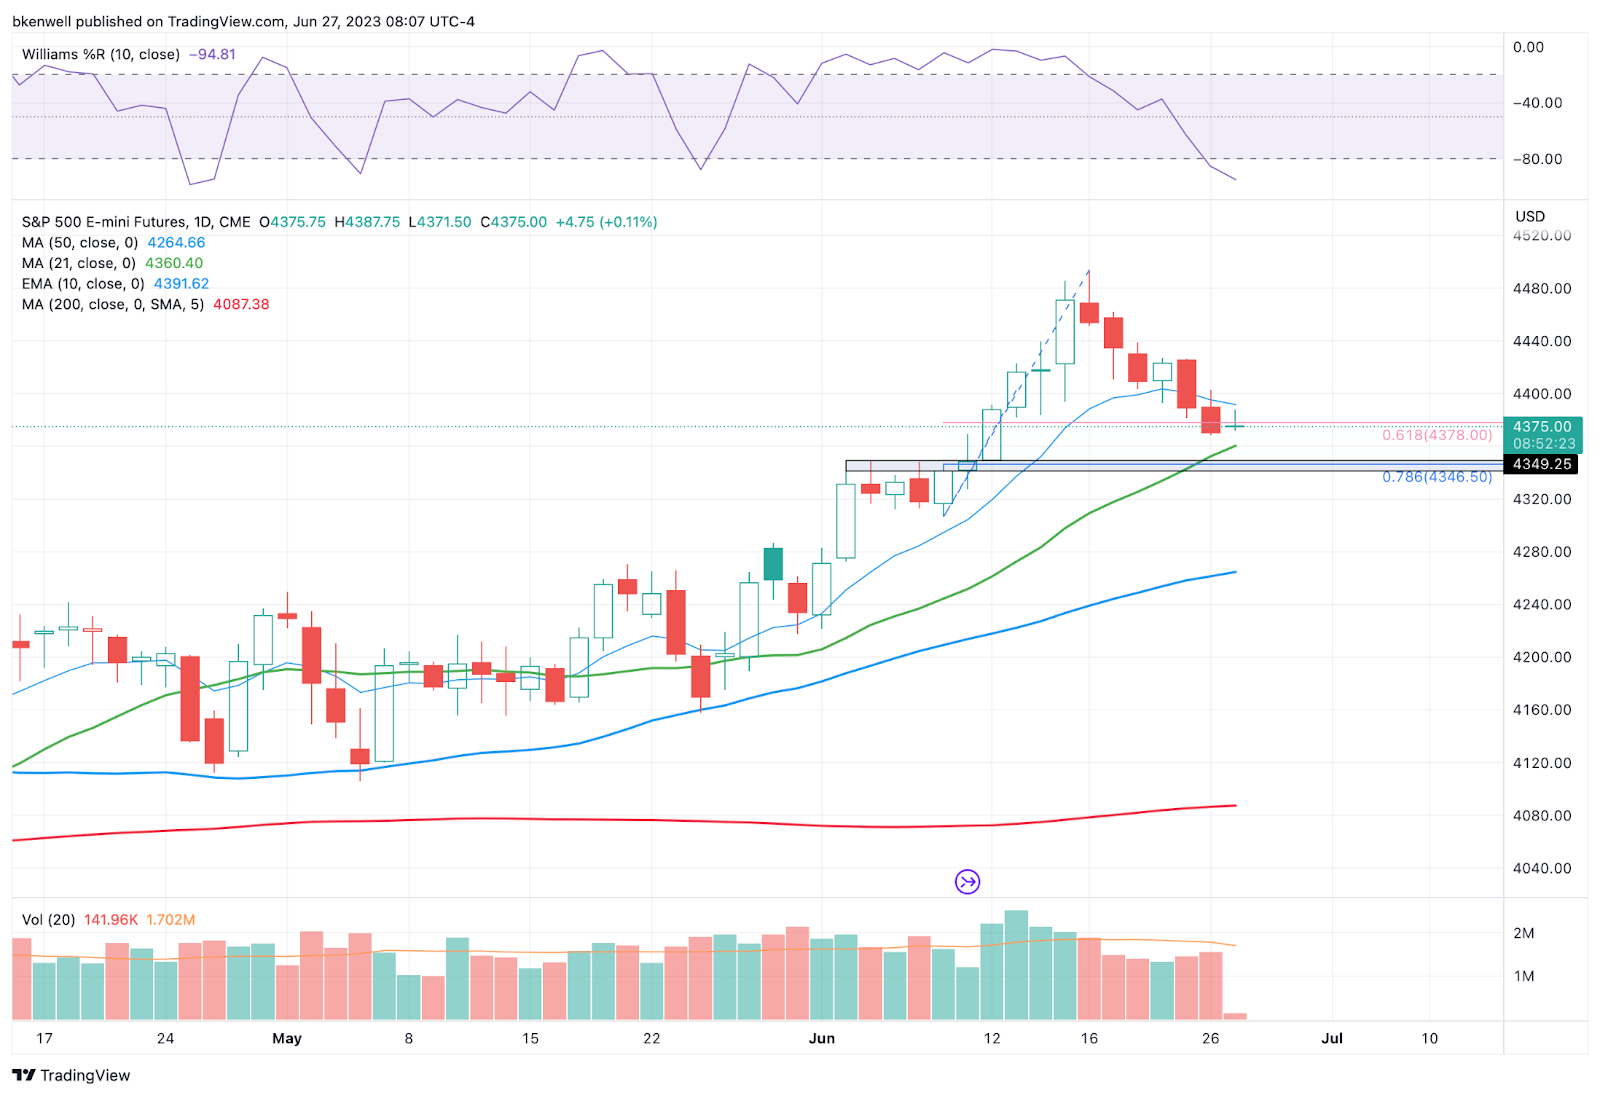
Upside Levels: 4400, 4426, 4435, 4450
Downside levels: ~4360, 4345-50
SPX
On the SPX, it’s a similar layout, but with 4300 being the downside objective.
4330-32 held perfectly yesterday, but now we have to see if yesterday’s low can hold.
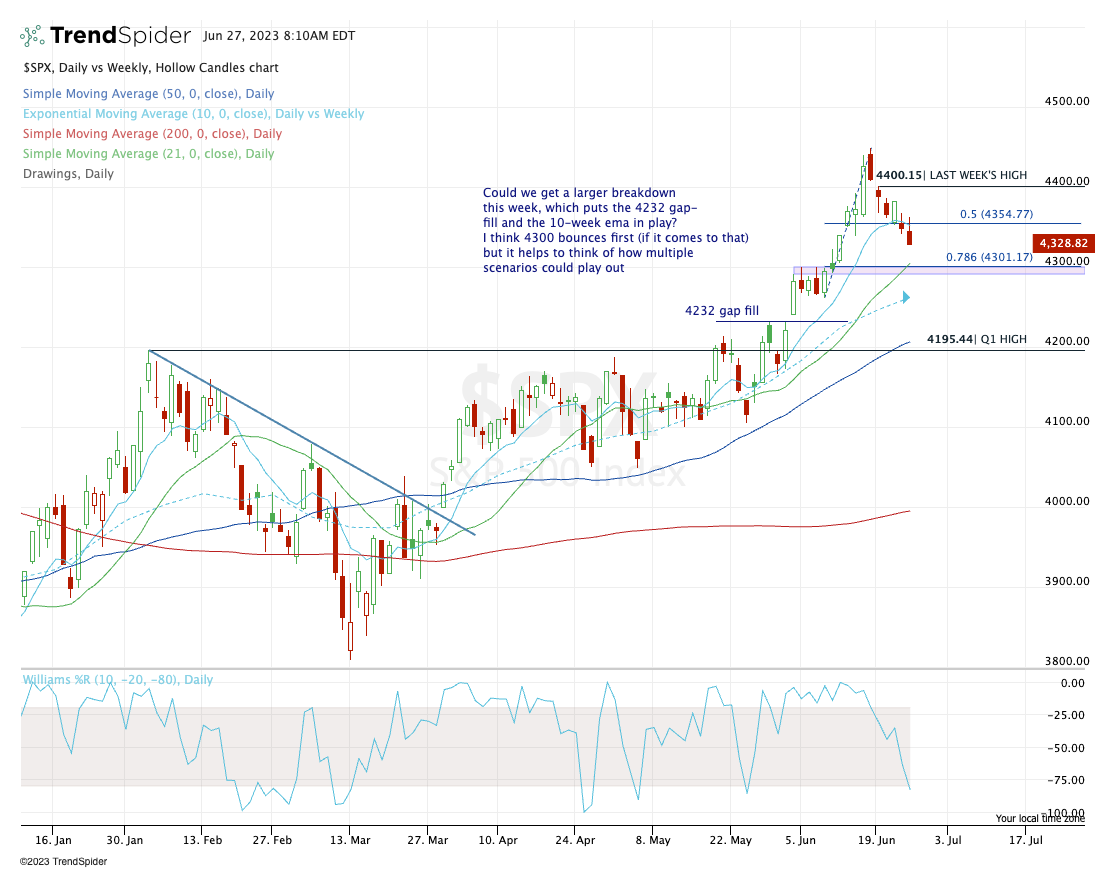
Upside Levels: 4362-65, ~4380, 4400
Downside Levels: 4328 (y’day low), 4300
SPY

Upside Levels: $434 to $435, $437 to $437.50
Downside Levels: ~$431 (y’day low), $429 to $430
NQ
Mostly the same levels as yesterday shown below. Tested down to 14,853.50 and closed just 3 points off that level, then bounced ~80 handles.
Let’s see if they retest yesterday’s low. If mega-cap tech is weak again, the NQ ill be vulnerable

Upside Levels: 15,000, 15,125-150, 15,225-250, 15,350
Downside Levels: 14,960-990, ~14,830-850, 14,750-775
QQQ

QQQ needs buyers to step in — now. We are at the 21-day moving average, the 61.8% retrace and the prior breakout area.
However, if the ES/SPX is going down to 4350 & 4300, respectively, the Nasdaq will likely take more heat. That could put a potential overshoot in play, which would have me watching the ~$353.xx area on the QQQ.
MSFT

There are potentially more rewarding areas to buy MSFT and TSLA. However, these trends have been incredibly strong and those who remain bullish on this group will likely be stepping at the first real area of potential support.
For MSFT, the 10-week moving average and the ~$322 area is hard to ignore.
$322 was prior resistance turned support, while the 10-week ema is an added layer of potential support. However, keep in mind that the gap-fill down to $316.50 is possible (which lines up with the 50-day).
I’m not saying that to cover both sides of the trade, but am simply pointing out the strong trend and potential support, and the reality that lower prices could be in store.
If we test ~$322, then ~$330 is the first upside target. One consideration for a stop would be in the $314 to $315 area, leaving room down to the 50-day/gap-fill in case it comes to fruition.
Mid-level pullbacks can be harder to time and sloppier than trend-trading. It’s time to hone in and focus.
Size accordingly.
TSLA

Tesla is a similar situation, with the rising 21-day moving average and the gap-fill sitting at $235.
If this level fails, then we could be looking at a retest of the Q1 high near $217.50, along with a test of the 10-week moving average.
For those trading the $235 buy zone, a push back toward the $247.50 to $250 area would be the first target. On the downside, TSLA really needs to hold the $223-225 area, although a stop could certainly be placed above that area for tighter risk control.
When things “get slick” like TSLA right now, you have to be on watch for a stop run. How it closes will be key.
Again — size accordingly.
Open Positions
Bold are the trades with recent updates.
Italics show means the trade is closed.
Any positions that get down to ¼ or less (AKA runners) are removed from the list below and left up to you to manage. My only suggestion would be B/E or better stops.)
** = previous trade setup we are stalking.
XXXXXXXXXXXXXXXXXXXXXXXXXXXXXXXXXXXXXXXXXXXXXXXXXXXXXXXXXX
Down to Runners in GE, CAH, LLY, ABBV, AAPL, MCD & BRK.B. Now Add META, AVGO, UBER, CRM, AMZN and CVS.
Keep reading with a 7-day free trial
Subscribe to Future Blue Chips to keep reading this post and get 7 days of free access to the full post archives.