Ominous Pattern Shows in S&P | Trading Bitcoin, HP on Earnings
Will we roll back over in the markets? It's one scenario.
Technical Edge
NYSE Breadth: 45.2% Upside Volume
NASDAQ Breadth: 62.5% Upside Volume
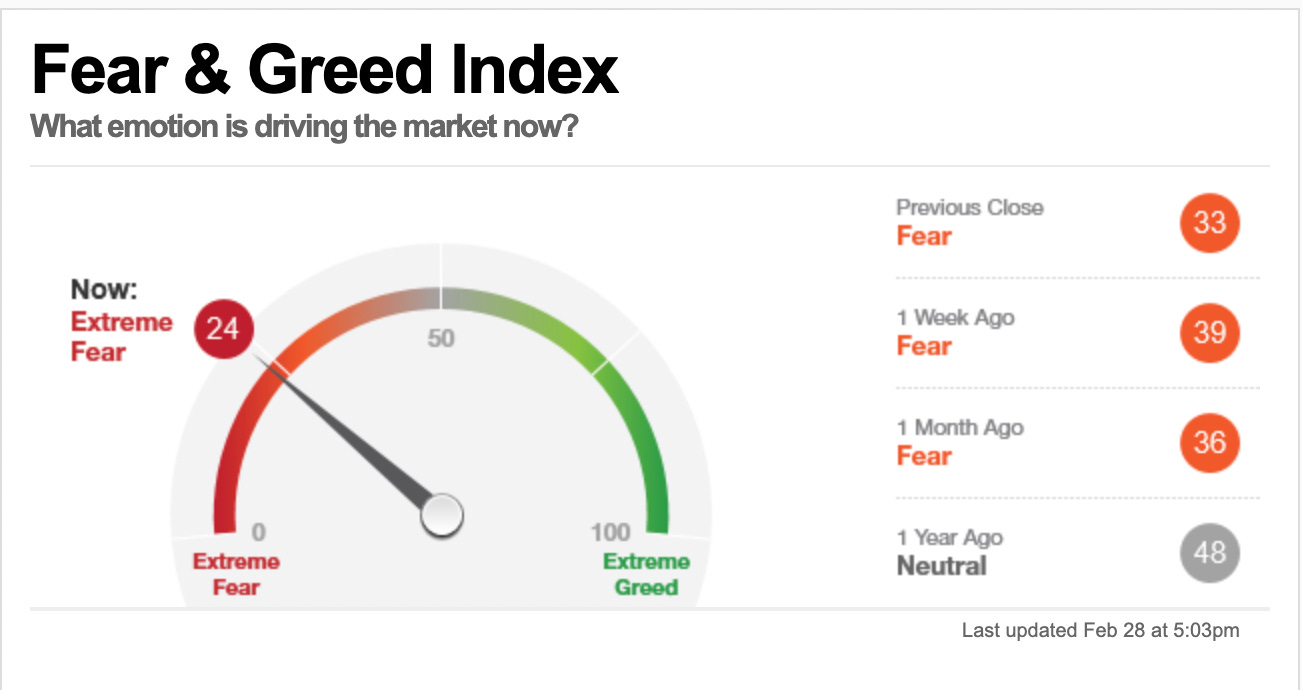
Welcome to March. As push into the final month of the first quarter, the market still looks dicey. Sentiment is finally rolling over, crude is hitting new highs over $100, the VIX remains above $30 and the market remains on edge.
Each time the VIX pushes into the $37 to $38 area, it ends up fading. We’ll see if that remains the case in the days and weeks ahead.
As it pertains to breadth, many were looking for another 80%+ upside day on the NYSE. That may have indicated a return to demand in equities. As it stands though, we could not generate another 80% day like we did on Friday. Nor could we on Thursday despite the big reversal.
For now, we continue on in the same environment we’re now getting used to.
Game Plan
S&P 500 futures are gapping down once again and we remain fixed on trading lightly. Size smaller and when you’re wrong don’t hesitate — get out when you hit your stop.
When we look at the S&P, it ran right to our top upside target in the overnight session:
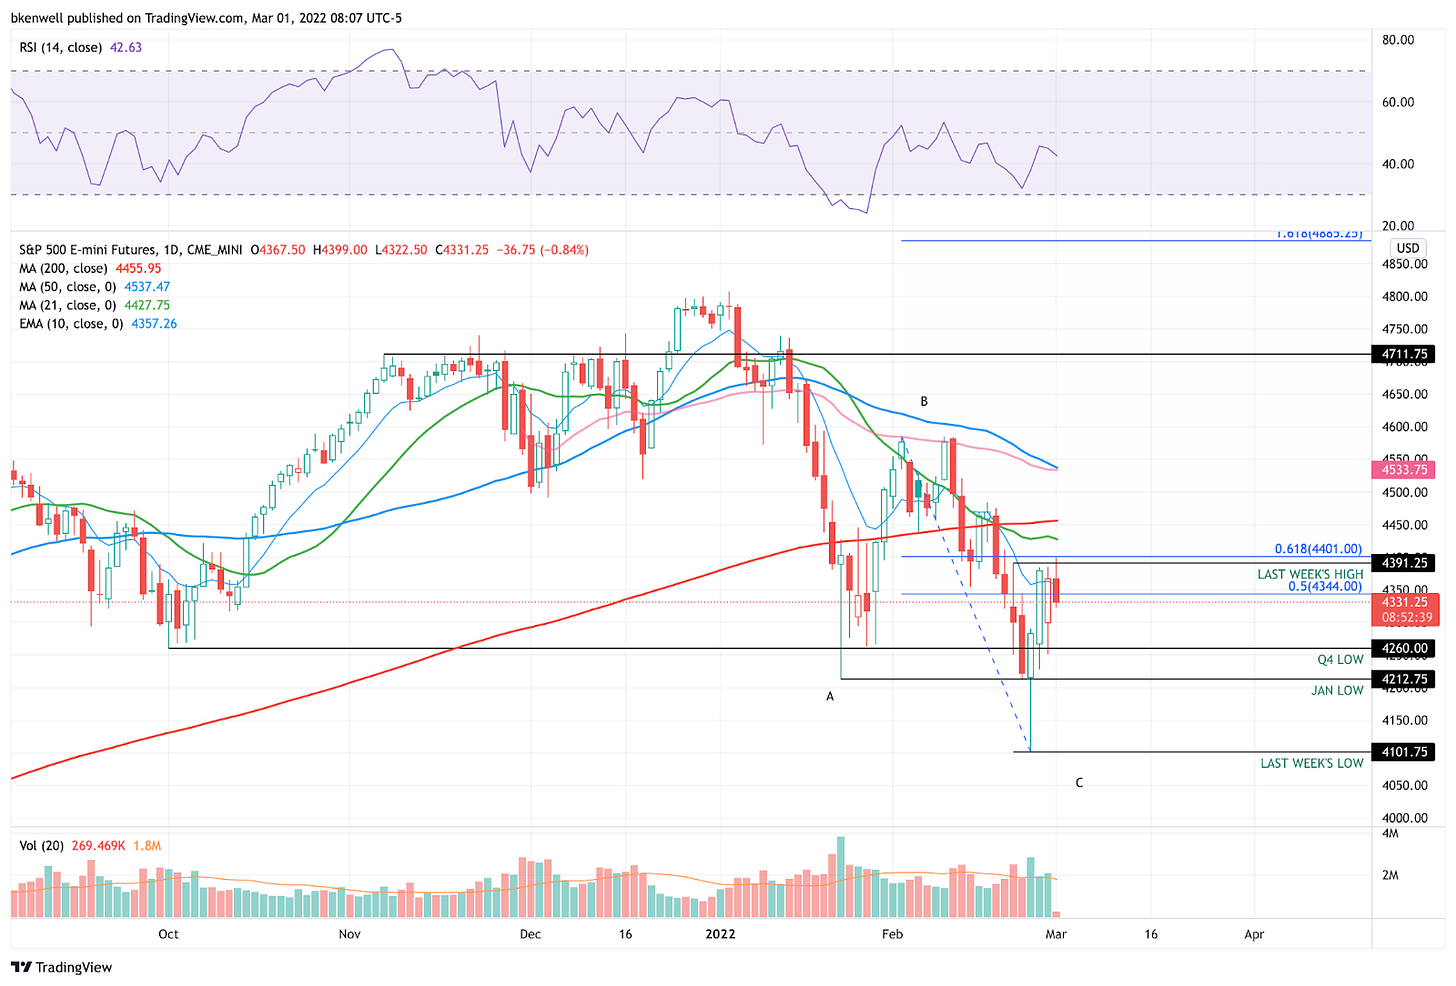
4391 to 4400 — Last week’s high and the 61.8% retracement
Let’s lay out the S&P, because it’s important and has similarities to last month and could potentially point to another move lower.
S&P 500 — ES
Feel free to extrapolate this layout to the SPY.
The S&P is currently in an “ABC” type correction. The question — and worry — is, does it become an “ABCDE” type correction? Basically, a three-wave or a five-wave correction is what traders are contemplating.
We had the rally to the 61.8% retracement, which is exactly what happened a few weeks ago (aka, the “B-leg” high). If this is anything like the last time around, the SPY may ultimately roll over again and retest some of these lower levels.
That could set us up for a selloff into the Fed event on March 16 and a potential rally on the news. I don’t want to get into predictions, but it’s one scenario in the back of my mind.
The upside levels are:
The 10-day ema — bulls need to reclaim this level
4391 to 4400 — Last week’s high and the 61.8% retracement
4399 is the O/N high
Downside levels of interest:
4344 — the 50% retracement
4318
4251.50 to 4260 — Monday’s low and the Q4 low, respectively
4212 — January Low
Nasdaq, Gold, Bitcoin, HP & Individual Stock
Nasdaq — NQ
Feel free to extrapolate this layout to the QQQ.
Keep reading with a 7-day free trial
Subscribe to Future Blue Chips to keep reading this post and get 7 days of free access to the full post archives.


