Opex Friday Comes as Stock Bulls Lose Grip
The sellers are gaining momentum, but will they take control?
Technical Edge —
NYSE Breadth: 70% Upside Volume
Advance/Decline: 72% Advance
VIX: ~$20.75
Yesterday we said, “there are multiple catalysts for both the bulls and the bears,” but Bullard made sure the bear’s could make a stance. Now, the S&P is struggling with some major levels.
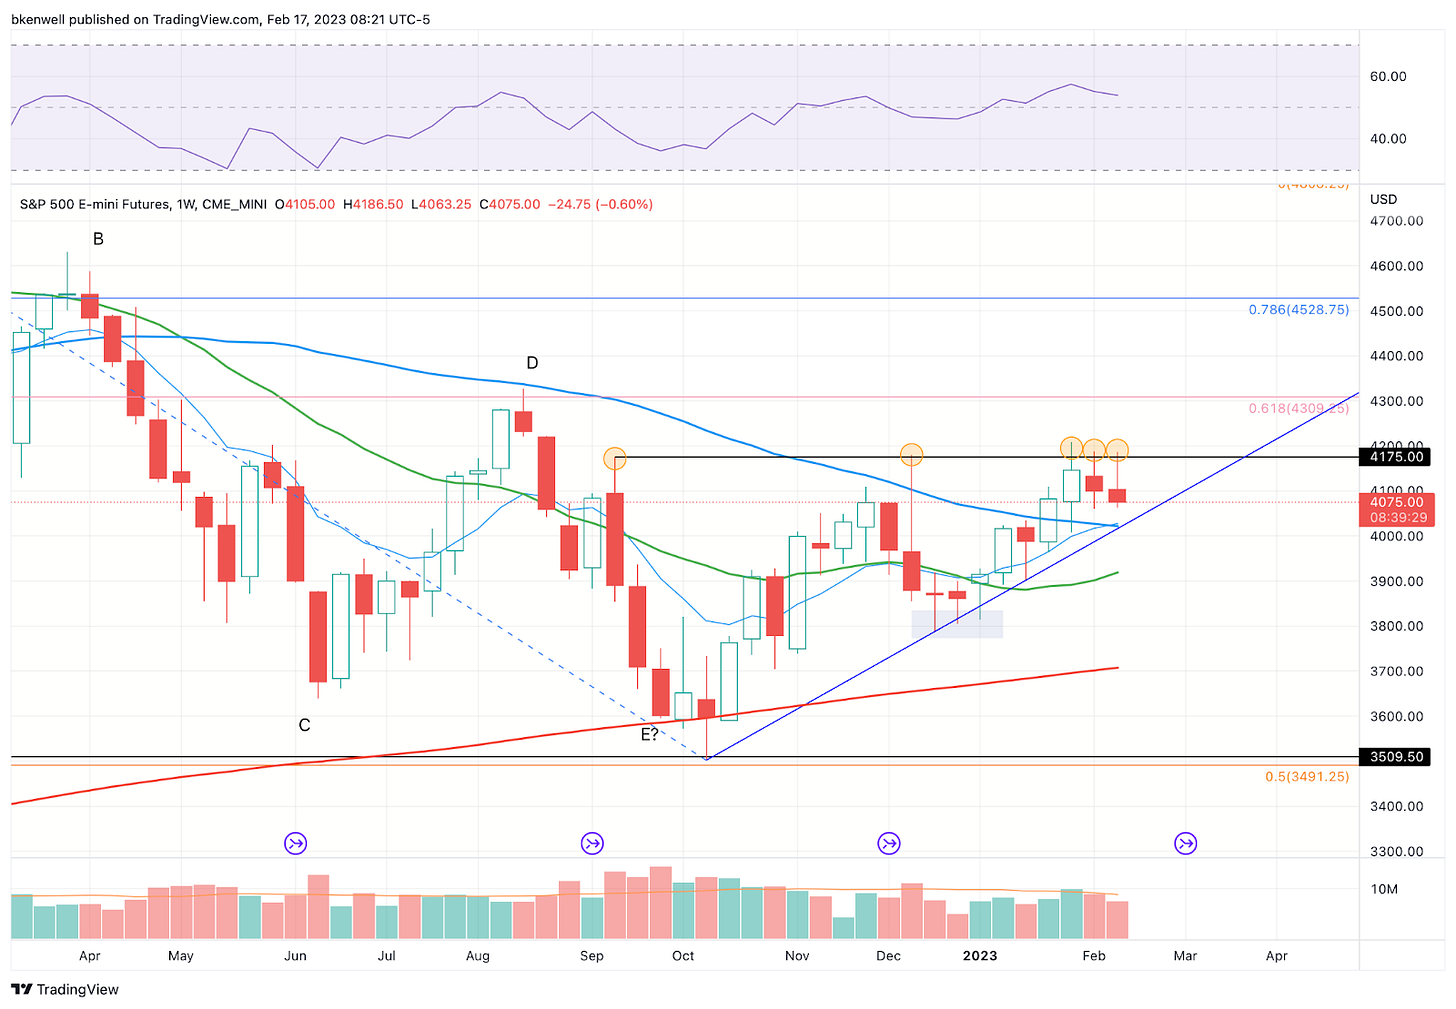
The ES couldn’t reclaim 4175 to 4185 and wavered at major resistance. The SPY and SPX couldn’t hold $410/4100 — the Q4 high — and are rotating lower.
Now for all three assets, last week’s low looms large. A gap-down open is likely on tap, which has me looking to buy the dip for a trade.
S&P 500 — ES
The ES is cracking the 21-day sma and pressing into last week’s low. Keep a close eye around 4060 — last week’s low. That could prove to be a key pivot on Friday.
Can we test/crack this level and reclaim it for a bounce?
On the upside, 4095 to 4100 is key. It marks the Globex high, yesterday’s low and the 21-day sma. If it can be reclaimed, it’s a big win for the bulls. Otherwise, “risk-off” may be the takeaway.
As for the weekly:
Look at those major rejections at 4175, my goodness! On the larger timeframe, I can’t help but notice the 4025-ish area, as the 10-week and 50-week moving averages converge with uptrend support.
That zone should be good for a bounce, if we see it in the next few days.
SPY
Personally, I’m looking at today’s gap-down as a potential opportunity, leaning into it as an opportunity to buy vs. sell.
That’s with the 21-sma in play, as well as last week’s low near $405.
Remember yesterday we said things could get sloppy below the $410 to $409 area. Well, this is sloppy.
Look to see if buyers step in near the open for a trade. Otherwise, let’s see how the S&P trades Friday (Opex day) and sets up for next week.
Dollar — DXY
Daily/weekly chart above of the DXY, which has been rallying hard off the lows and as outlined yesterday, is a negative for equities.
It’s above downtrend resistance — the 50-day and 10-week moving averages — but into a key pivot area. Not a trade but keep an eye on the dollar. A sustained up-move creates a problem for the bulls.
Bonds — TLT
The rising 10-year yield has also created a problem for equities, but the TLT is coming into a key gap-fill area, the 50% retracement, the January low and the $100 area.
Aggressive bond bulls can be buyers in this zone with a stop near $98.
Non-traders can simply keep an eye on this level to see if a bid comes into bonds — and thus, stocks too.
Open Positions
Bold are the trades with recent updates.
Italics show means the trade is closed.
Any positions that get down to ¼ or less (AKA runners) are removed from the list below and left up to you to manage. My only suggestion would be B/E or better stops.)
** = previous trade setup we are stalking.
NVDA — long from $210 & Trimmed ⅓ at $219+, $223+ and $230
Absolute beauty thus far. Down to ¼ against a B/E or better stop. Up to you on how to manage from here
AMD — trimmed down to ½ position at $85 to 86. Trim down to ⅓ if we see $87+. Stop-loss of B/E or better now
**CAT — long on a weekly up rotation over $252.14. First target would be $258 to $261. Stop at $242.
** NG — looking for a move over $2.65. For UNG, over $8.92.
Go-To Watchlist
*Feel free to build your own trades off these relative strength leaders*
Relative strength leaders →
AQUA
AEHR
GE
NVDA, TSLA, SHOP
SBUX
MELI
NFLX
WYNN, LVS
AXP
BA & Airlines — AAL, DAL, UAL
TJX, ULTA, NKE
CAT
HCCI
XLE — XOM, CVX, COP, BP, EOG, PXD — (Weekly Charts)


