Technical Edge
NYSE Breadth: 30% Upside Volume
Advance/Decline: 31% Advance
VIX: ~$16.75
Inside day yesterday for the S&P, as indecision continues. For now, the KRE seems to have a high correlation with the index. If it’s under pressure, it will be hard for the index to rally and it will need mega-cap tech to play ball.
Remember, mega-cap tech has driven a bulk of the S&P gains this year, so it can’t withstand two big negatives (that being selling pressure in tech and KRE).
That said, the KRE is down in 8 of the last 9 days. If it fetches a bid today and tech continues to hold up or trade higher, the S&P has a path for higher prices.
This one’s a little longer than usual, but some good tidbits in here I believe.
S&P 500 — ES
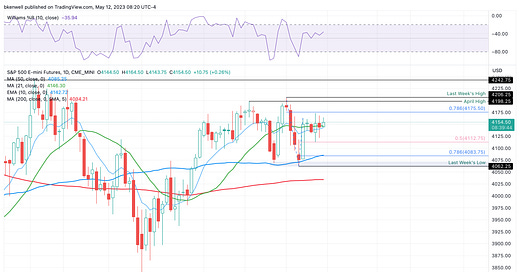
Notice how tight this range has been, not just in the last 4-5 days, but the last 6 weeks. The upside has been capped by ~4175. The downside limited to ~4115. We need a break of this area to push the outer edges of the range.
Upside Levels: 4170-75, 4198-4206, 4242
Downside levels: 4110-15, 4100, 4075-80, 4063
SPY
Daily-up over ~$412.50 without reversing down could put the current resistance zone in play (first level below under Upside Levels). Daily-down below ~$410 without reversing back up could put the $407 to $408 zone in play.
Upside Levels: $414-16, $417.50 to $418.30
Downside Levels: $407 to $408, $403 to $404
SPX
Upside Levels: 4150, 4167-70, 4187-4200
Downside Levels: 4100, 4085, 4050
QQQ
Tech has been a leader this week. The price action has been subtle but constructive. The QQQ got above $321, then stayed above it. Then it rotated over $323.50 and got our first target of $326+
Now let’s see if that $328-$331 zone is doable.
Pivot: ~$326
Upside Levels: $328-29, $331.50
Downside Levels: $323.50, $321.50, $318.50
NQ
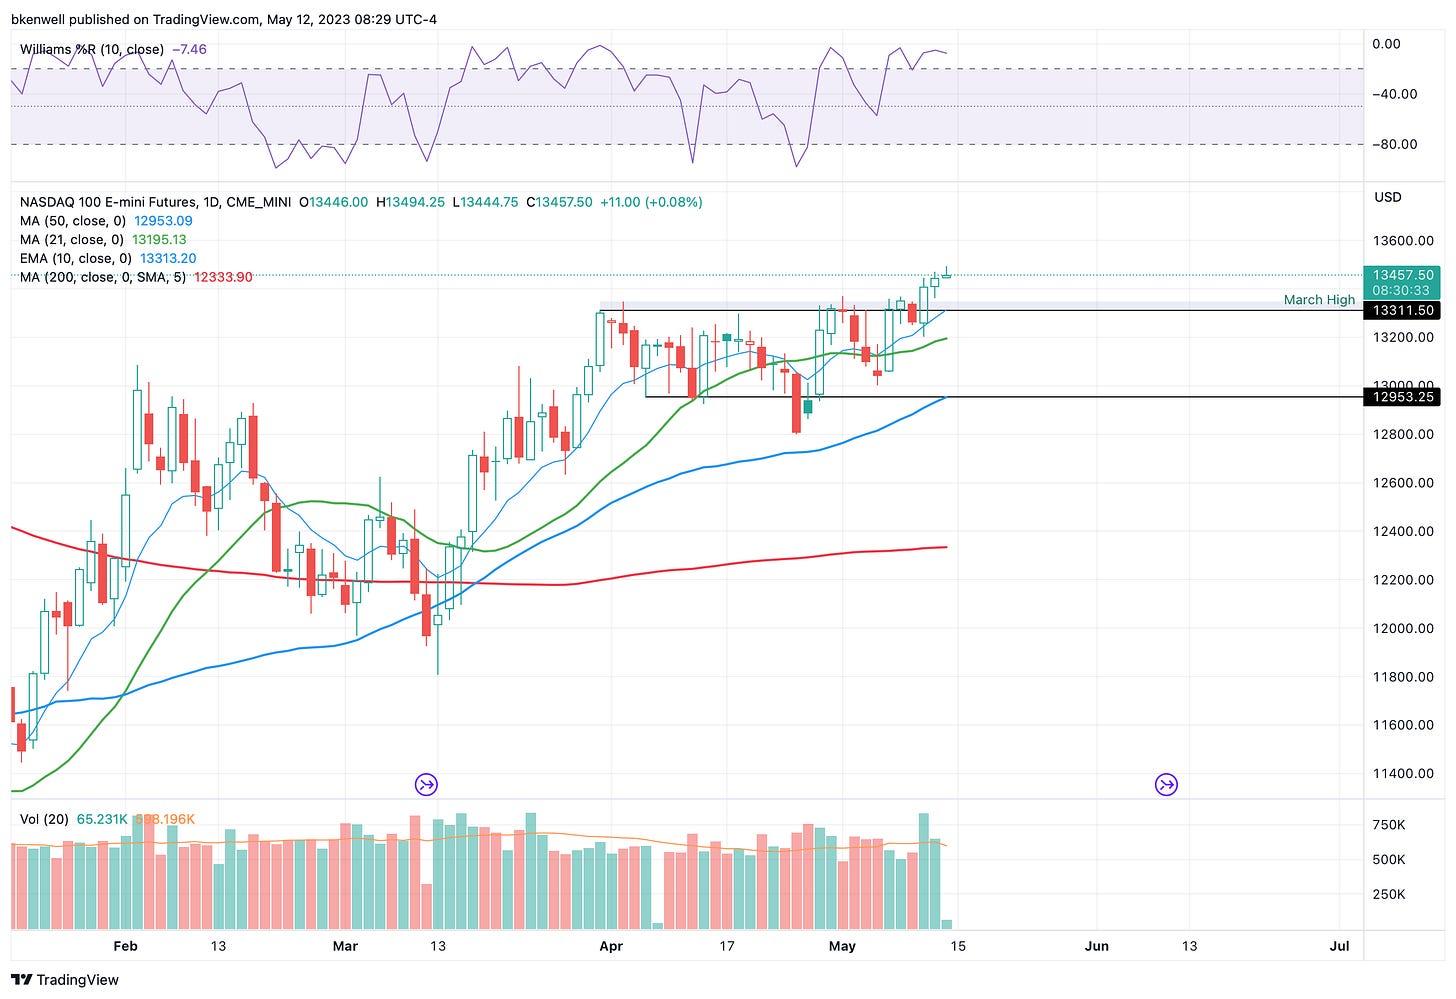
We need to stay above 13,300 to keep our trade intact. It hit our 13,450-70 target and came within 5 points of the 13,500 target. Great action in the NQ considering the price action in the ES.
I’m very interested in seeing how it handles a dip back down to the 13,300 area, which is the rising 10-day ema and the prior resistance level.
Upside Levels: 13,500, 13,600
Downside Levels: ~13,300, 13,160, 13,000
DXY
Less a trade, more an observation as the USD gains some steam. Watch last week’s high and the declining 50-day moving average in the DXY.
If this holds as resistance, $101.50 could be back in play on the downside.
However, a breakout could put $103.35 to $104 in play and would be a negative for equities.
Uber
I’m keeping an eye on Uber. Huge volume spike off earnings and now looking a bit tired. If we can get a dip to the prior breakout level of $37 to $37.50 and a tag of the 10-day, it may be worth a shot on the long side.
If this zone is tested and holds, $35.50 is a decent risk area we want to see hold. Ideally though, I prefer calls so I can limit my risk to “price paid” (aka I can just limit my risk to the net debit) and look for a bounce. $38 to $39 is an ideal first target.
Open Positions
Bold are the trades with recent updates.
Italics show means the trade is closed.
Any positions that get down to ¼ or less (AKA runners) are removed from the list below and left up to you to manage. My only suggestion would be B/E or better stops.)
** = previous trade setup we are stalking.
Down to Runners in GE, CAH, LLY, ABBV, AAPL, MCD & BRK.B
META — Trimmed ⅓ between $237 and $239. If we see $240-ish or higher today, let’s get down to a ½ position.
Break-even stop or can keep the $229 stop if playing more aggressive.
CRM — Closed above $200. Ideally, $207 to $208 is the first target zone. Can trim on any push to new high over $206.28
Conservative bulls can stop out below $198. Aggressive buyers may use $195 as their stop.
Go-To Watchlist
Feel free to build your own trades off these relative strength leaders
Relative strength leaders →
MCD, PEP & KO, WMT, PG — XLP
LLY
NVDA, CRM
MSFT, AAPL, META
ULTA, LULU, CMG
GE
HCA
DKS
WYNN
MELI


