***Technical error delayed today’s note, which is as follows:
Technical Edge —
NYSE Breadth: 70.5% Upside Volume
NASDAQ Breadth: 60% Upside Volume
VIX: ~$23
Game Plan: S&P, Nasdaq, Individual Stocks
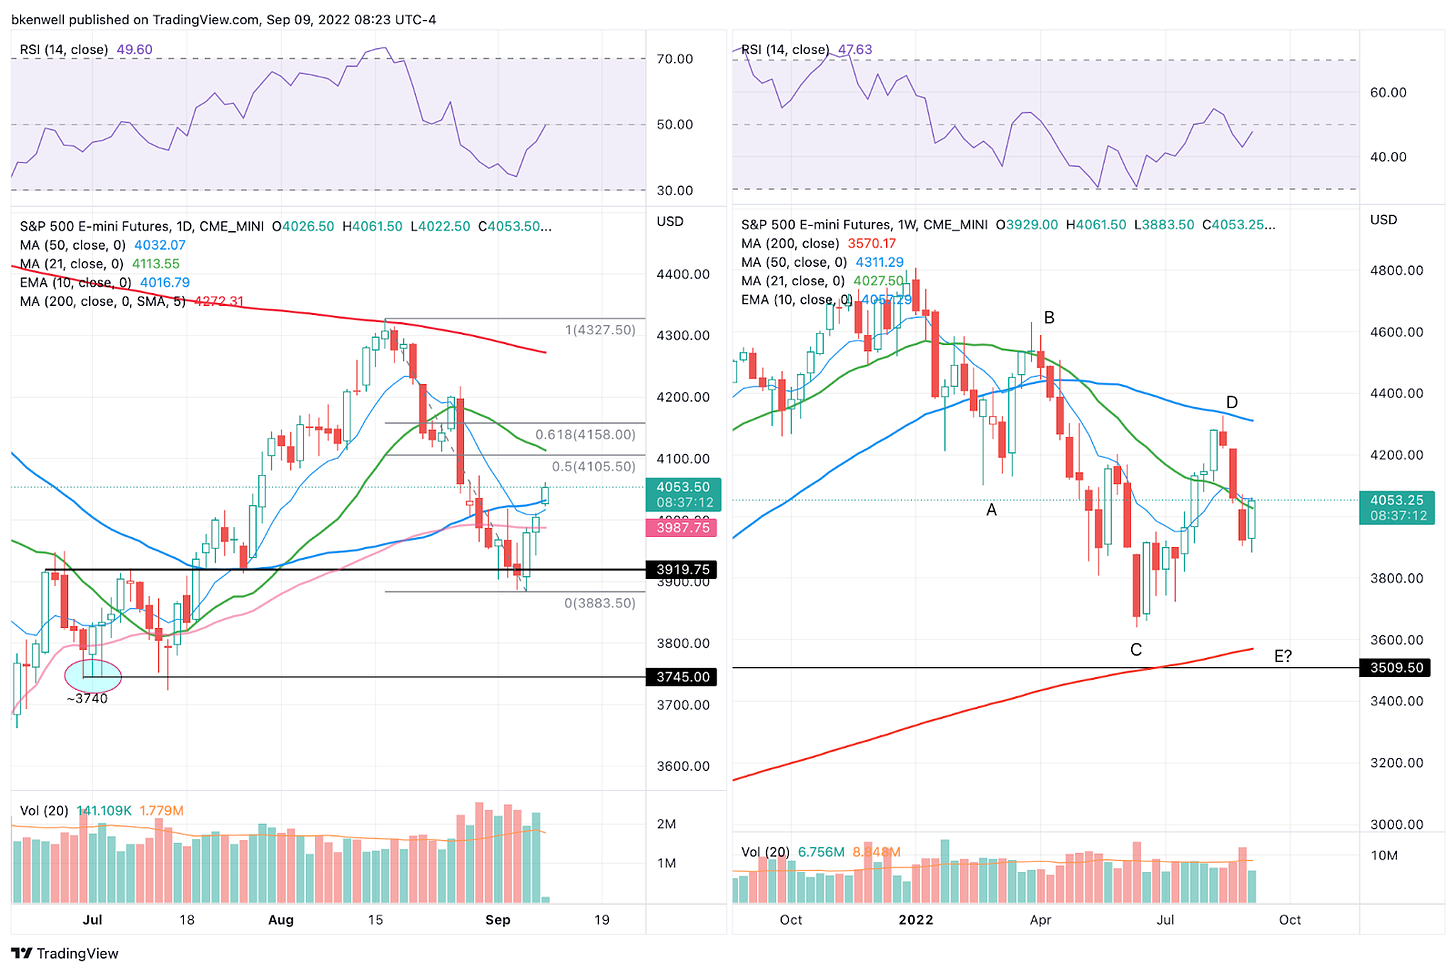
Not much to add other than yesterday’s rally was only mildly convincing, as the S&P sits at the 10-day/10-week/50-day moving average area, aka active resistance. It got there in a volatile session on mild upside breadth.
It would have been more convincing if the dollar continued to decline, if bonds hadn’t rolled over and closed at session lows, and if the breadth was better.
That said, we’re gapping up notably into the session, with bonds rallying and the dollar falling. That all sets the stage for a tricky trade and after a good week, I’m honestly in no hurry to do anything today or trade in large size. If that’s you too, feel free to take no trades on the day or walk away from the screens unless the setup is too attractive to ignore.
I’m inclined to sell the open/early rally given yesterday’s weak breadth, but “FryDay” gets its name for a reason.
Let’s look at the charts.
S&P 500 — ES
On the left is the daily chart, on the right is the weekly.
Notice on how the ES lost the 10-week moving average two weeks ago, then last week it was rejected by this measure. Now it’s again trying to regain this mark, but is stalling near that area now.
That said, it’s pushing above the 50-day as we speak.
Is it so hard to believe that we retest the 4025 to 4030 area? A full gap-fill puts 4011 on the table.
Whether we dip off the open or not, ~4100 is a notable area on the upside to keep an eye on (either today or early next week). That marks the 21-day moving average and the 50% retracement.
SPY
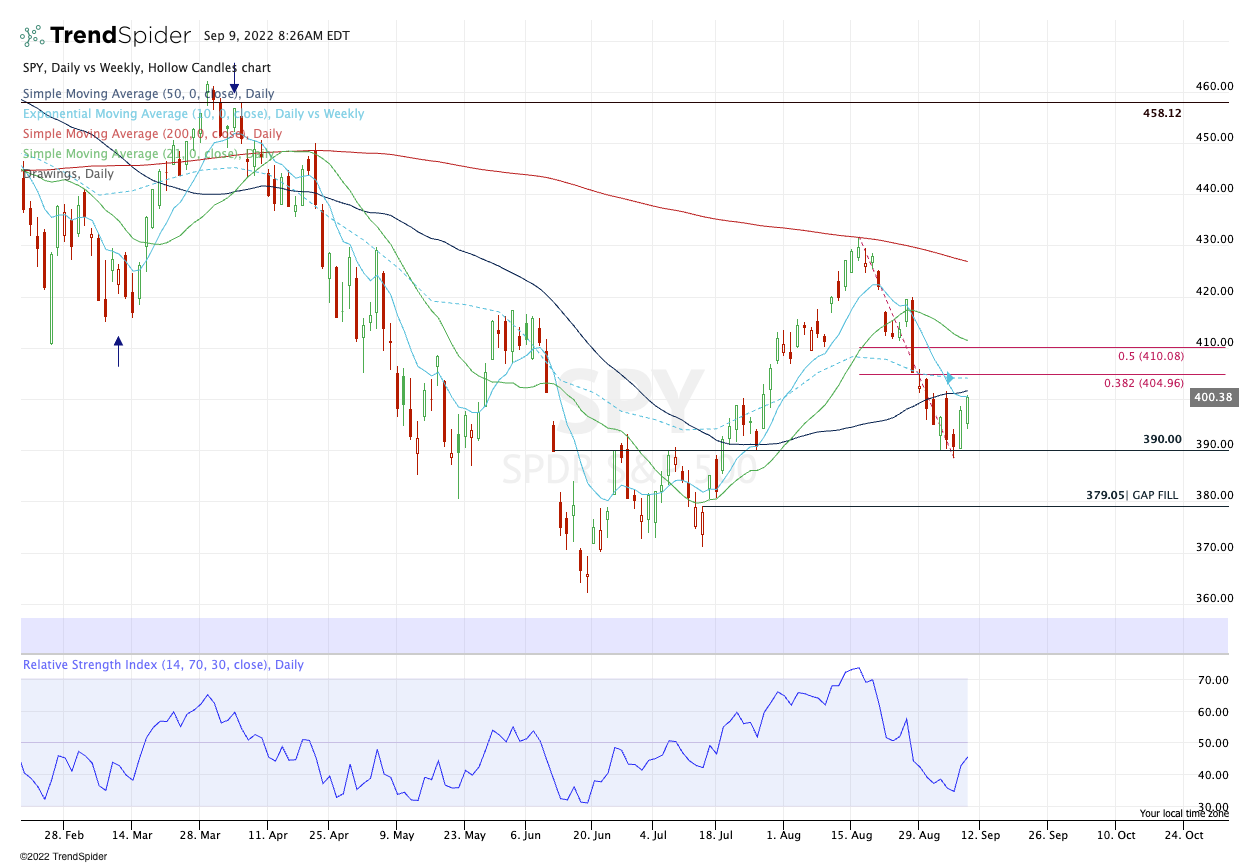
Yesterday, we called the $400 to $401 area a sell zone and it worked flawlessly, as the SPY tagged $400.86, then retreated to $395. The pullback just didn’t stick as the SPY then rebounded into the close.
Near $400 on the close and almost $404 in the pre-market, the setup is a little harder this morning.
If we see $404 to $405 on the opening gap-up, I may be so inclined to try a sale. That’s the 38.2% retracement and the 10-week moving average. If anything, it could be a cash flow trade and the SPY will either burst right through these levels (and we’re wrong with a small loss) or it will retreat and we’ll put a couple bucks in our pocket.
Nasdaq — NQ
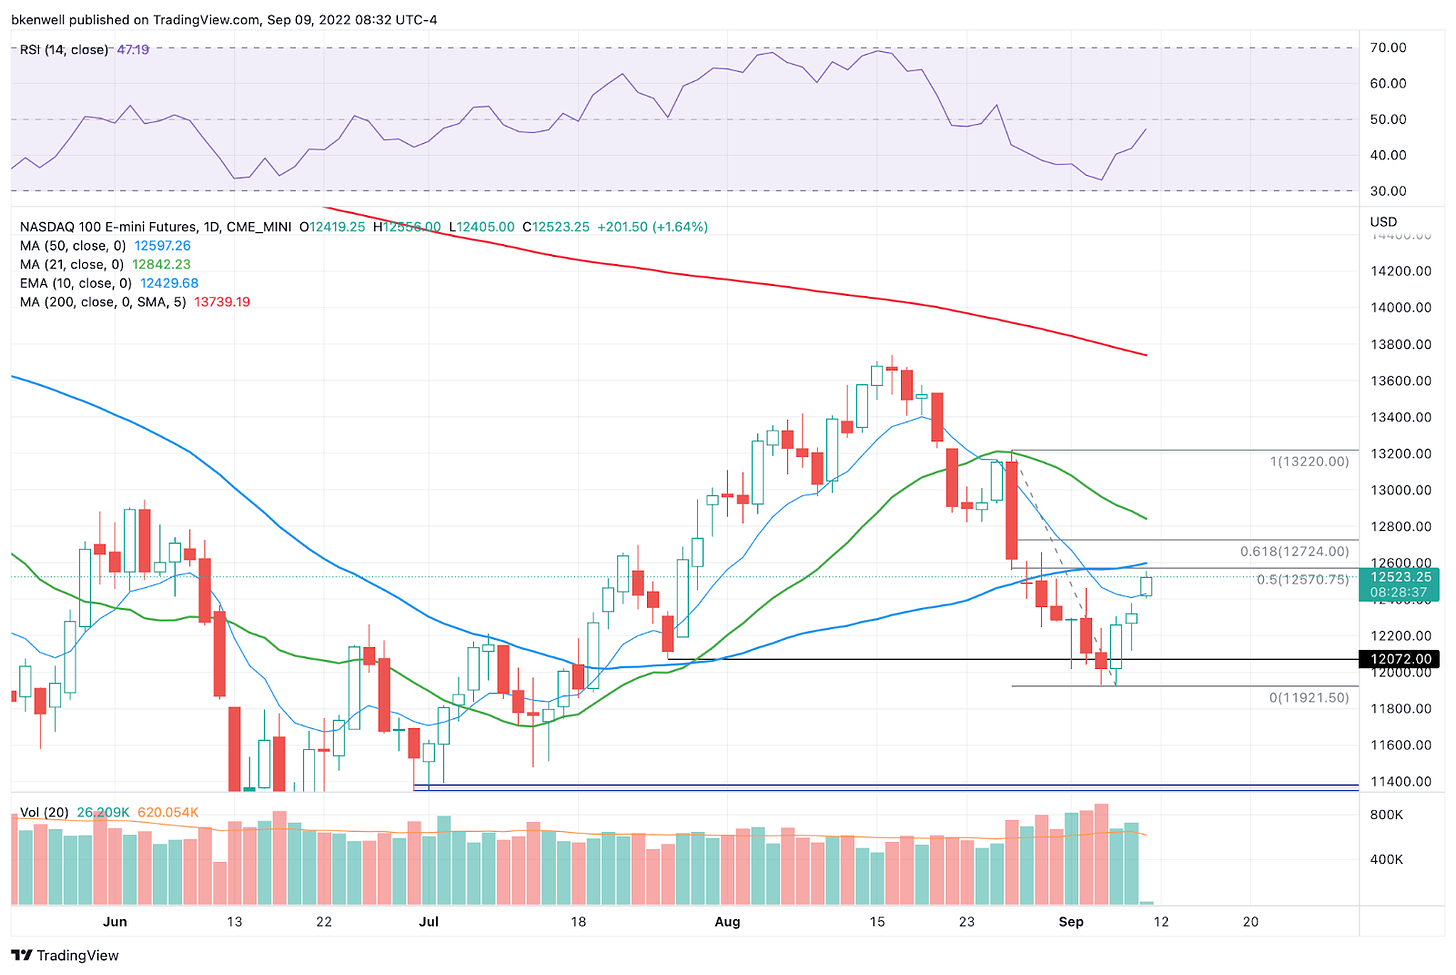
“If the NQ can continue pushing, 12,375 could be in play (roughly the 10-day ema).”
Yesterday’s high? 12,379.
We’ve had a really great trade in the Nasdaq (NQ and QQQ) this week. So I’m not looking to push my luck, but keep a very close eye on the 12,570 to 12,600 area, which is the 50% retracement and the 50-day moving average.
Keep reading with a 7-day free trial
Subscribe to Future Blue Chips to keep reading this post and get 7 days of free access to the full post archives.


