Rally More or Reverse? Here's How to Navigate the Market Right Now
The S&P has clear levels to watch. So do bonds.
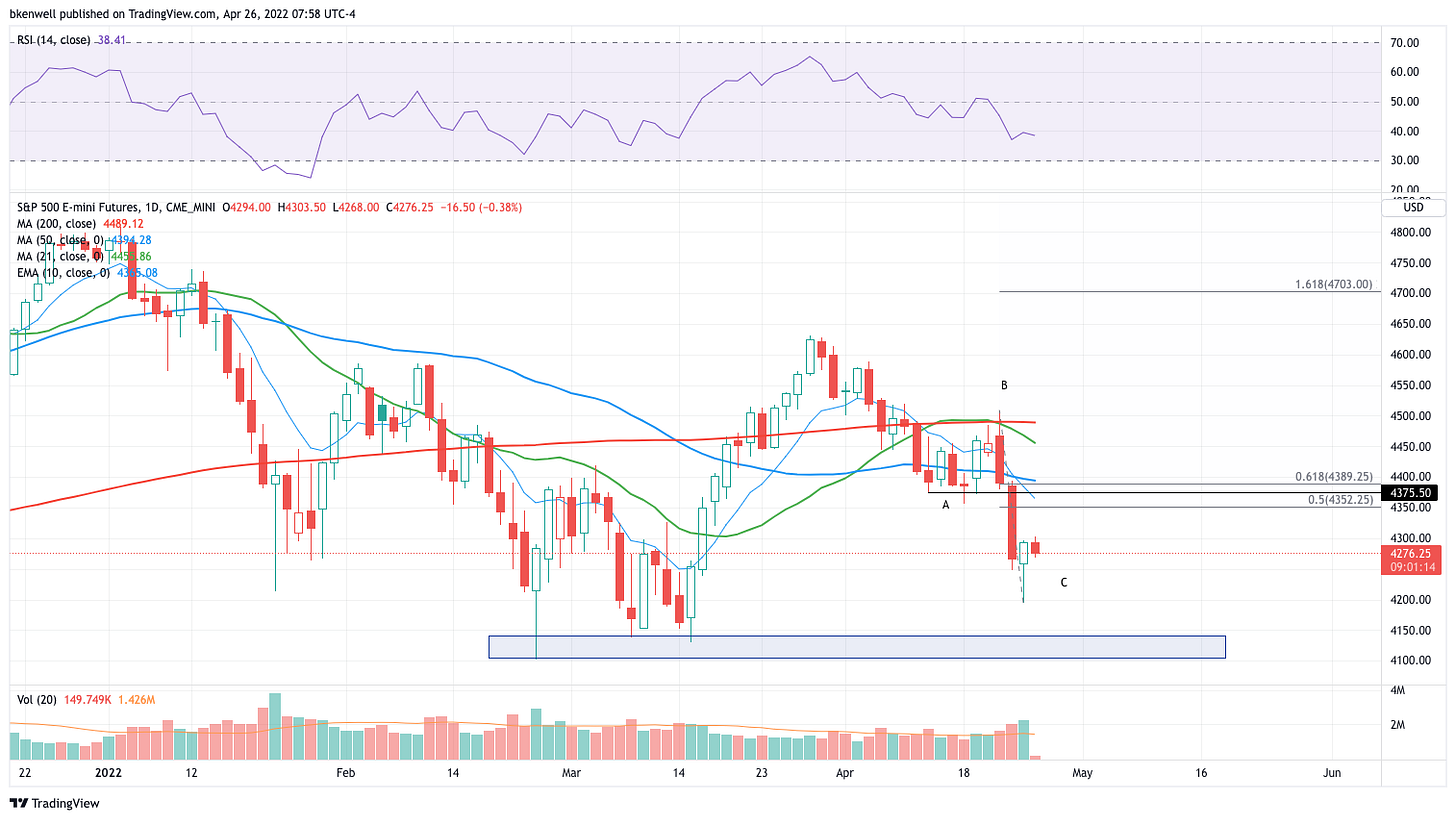
If you don’t have time this morning, please take a few minutes sometime today to view our “Big Picture” video on the S&P 500. It highlights this year’s key pattern thus far (3-wave vs. 5-wave moves) and lays out a few possible scenarios ahead of next week’s Fed event.
Good luck today!
Technical Edge — Game Plan
NYSE Breadth: 46.2% Upside Volume
NASDAQ Breadth: 70.2% Upside Volume
Volatility is again expanding and the ranges are becoming wider. We talked about stop-losses in the video and what they can signal in these types of environments. For now, we continue to focus on the indices, as individual stock trades become too “iffy” in this type of environment.
Yesterday the markets posted a reversal and it will be key to see if it can gain momentum from here or if it stalls out.
S&P 500 (ES and SPY), Bonds (TLT) and Individual Stocks
The “Big Picture” of the S&P is laid out in the video. For today, my approach is simple:
Keep reading with a 7-day free trial
Subscribe to Future Blue Chips to keep reading this post and get 7 days of free access to the full post archives.


