Technical Edge —
NYSE Breadth: 87% Upside Volume
Advance/Decline: 80% Advance
VIX: ~$22.50
Does the market know what it wants or not? Bad econ data gives the impression that a real recession is on the way. Good econ data says the Fed may not play so nice when it comes to the hawkish stance it’s been reiterating.
Tomorrow is the monthly jobs data, but this morning’s labor data was all better-than-expected (see below). That has the S&P moving lower. On the plus side, we were able to take another tranche off in our TLT long.
S&P 500 — ES
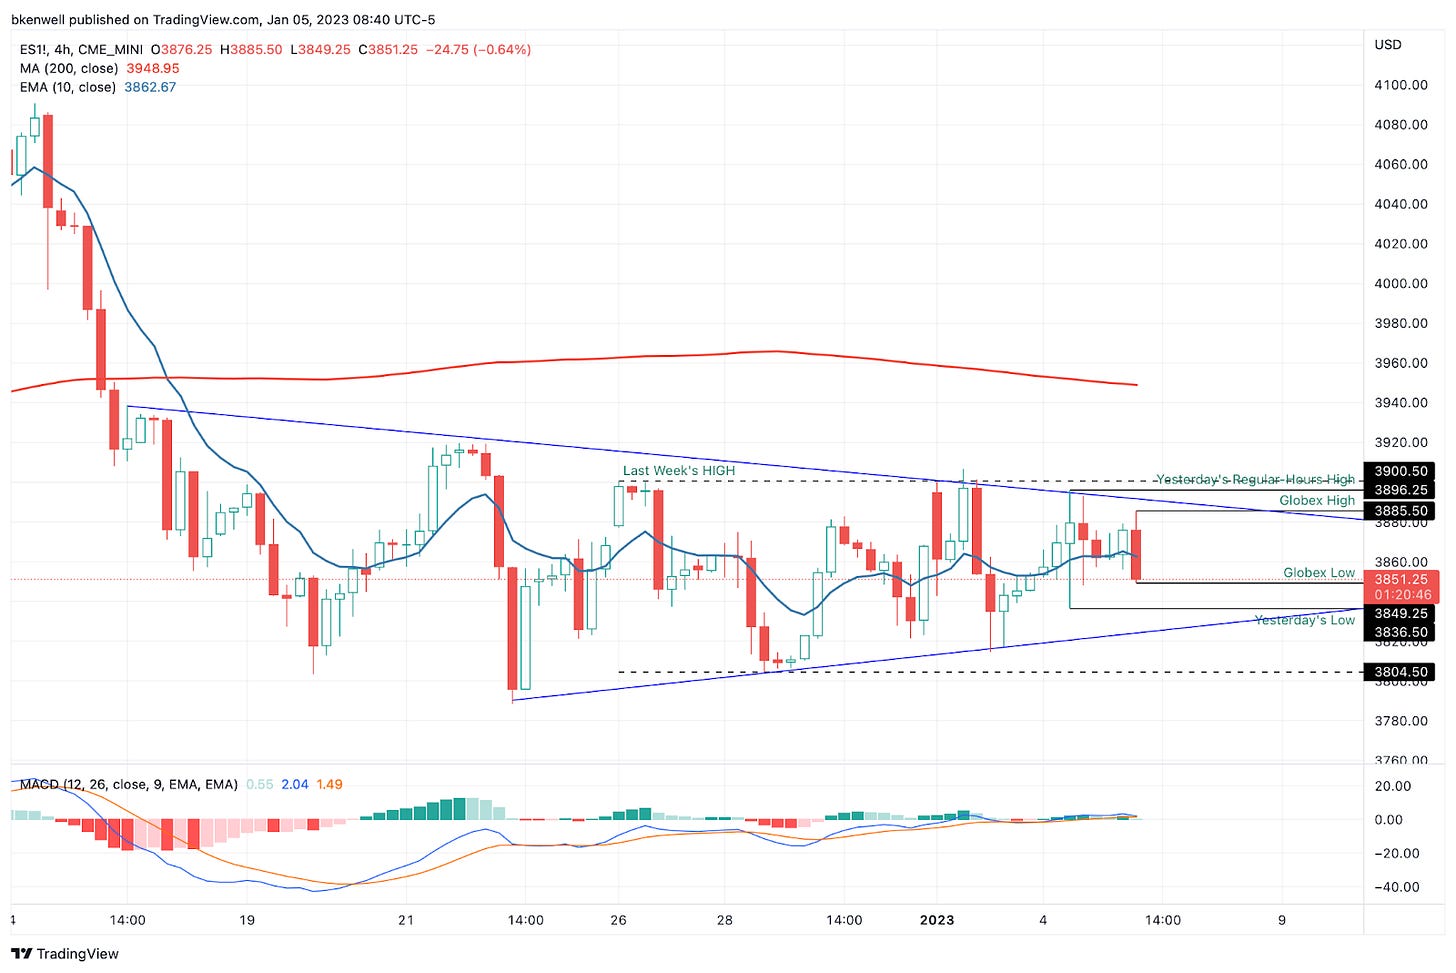
Above is a 4-hour look, just to give a slightly different perspective. We can see a series of higher lows and lower highs, as the price action continues to condense between last week’s week range.
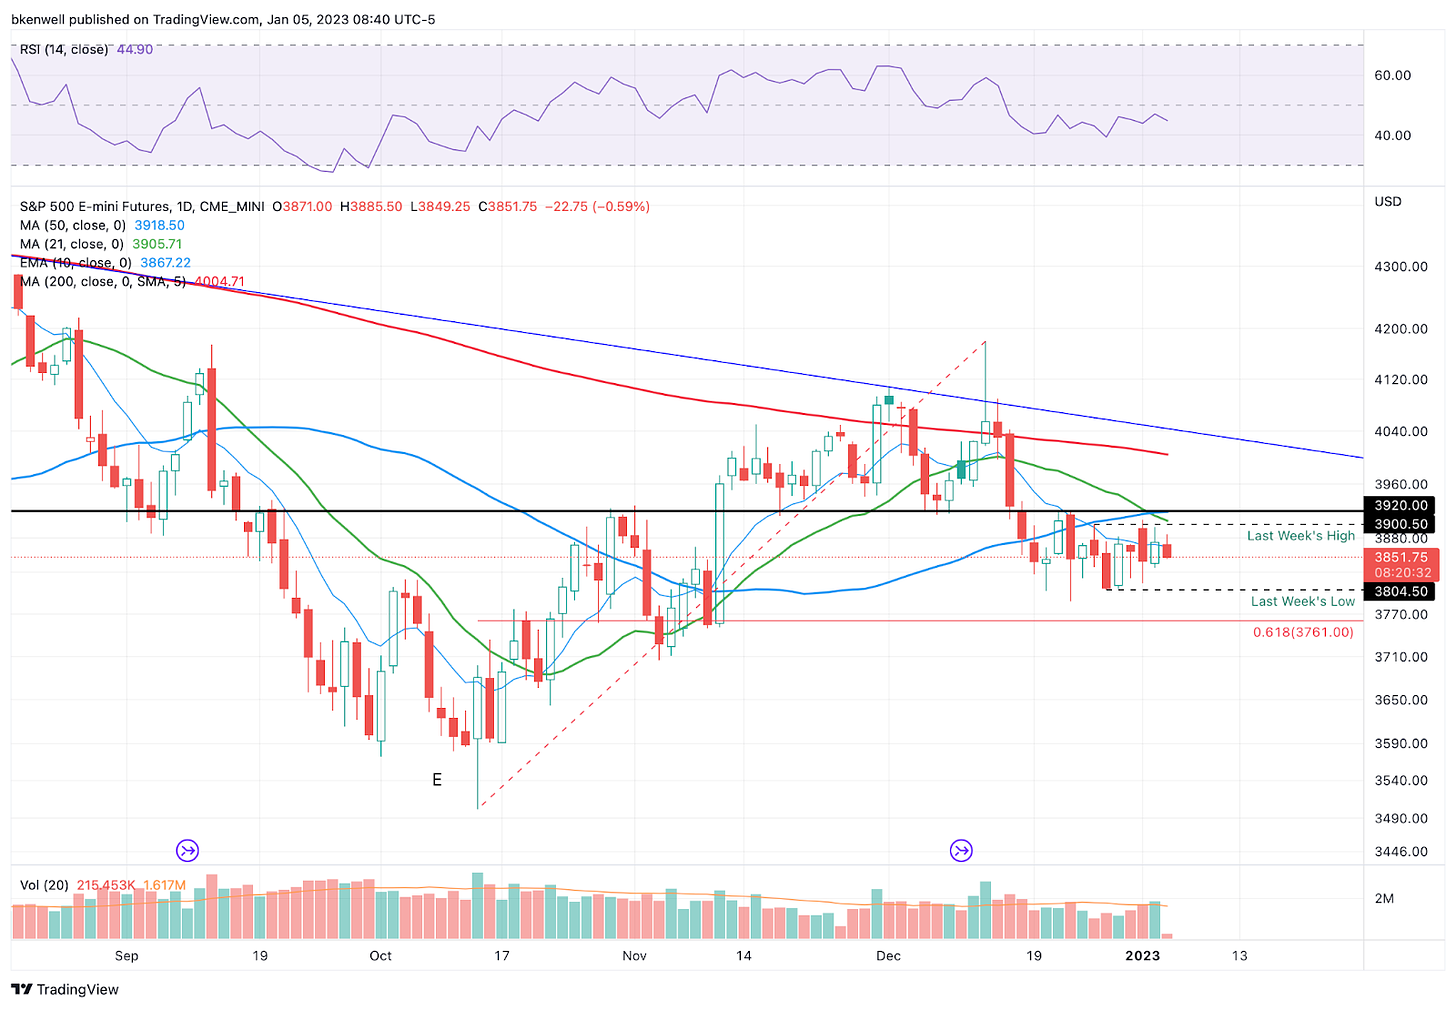
On the daily chart below, you’ll notice how clustered the ES’s range has been between 3800 to 3900 — an observation that seemingly everyone is finally catching on to this week.
The ES has declined in four straight weeks (as has the SPX and SPY). Notice though, how it continues to build below the 21-day and 50-day moving averages, as well as the critical 3920 level.
That level is a line drawn straight across the chart and there’s been notable action above and below this mark. Last week’s high of 3900.50 also keeps acting as a “sell.”
This is my line in the sand.
If the ES can push above last week’s high and not reverse lower, then 3920 is in play. Above that and we can have some fireworks as they run the buy-stops, potentially up to the 3985 to 4000 area.
Until then though, we must be a bit cautious below the 10-day moving average. A sustained break of 3836 opens the door down to 3800. Below that puts 3760 in play.
QQQ
Keep reading with a 7-day free trial
Subscribe to Future Blue Chips to keep reading this post and get 7 days of free access to the full post archives.


