Rate Hikes Are Testing the Bulls | Breaking Down the Nasdaq
From “possibly two, likely three hikes” to “likely three hikes, possibly four.”
Technical Breakdown
NYSE Breadth: 76% upside volume
NASDAQ Breadth: 78.3% upside volume
Given the decline, I’m surprised we did not have an 80%+ downside on the NYSE or the NASDAQ yesterday.
What we’re seeing now is investors reacting to the news that higher interest rates are on the way and traders trying to figure out how much of this is priced in. In other words, is the market overreacting to the news from the Fed?
On the one hand, rates may increase three to four times this year. That has me reminded of Q4 2018, when the Fed insisted on raising rates and the market rolled over hard as a result.
The S&P fell 21.4% while the Nasdaq dropped 23.9% until the Fed finally folded.
That said, many holdings have already corrected (or are in some form of a bear market already). The question becomes, are these groups already priced in for further rate hikes or will they suffer even more?
The silver lining is that, even if the Fed does go through with three to four rate hikes, we’re still talking about historically low rates and perhaps that will let inflation and some other costs cool down.
The other silver lining? Expectations.
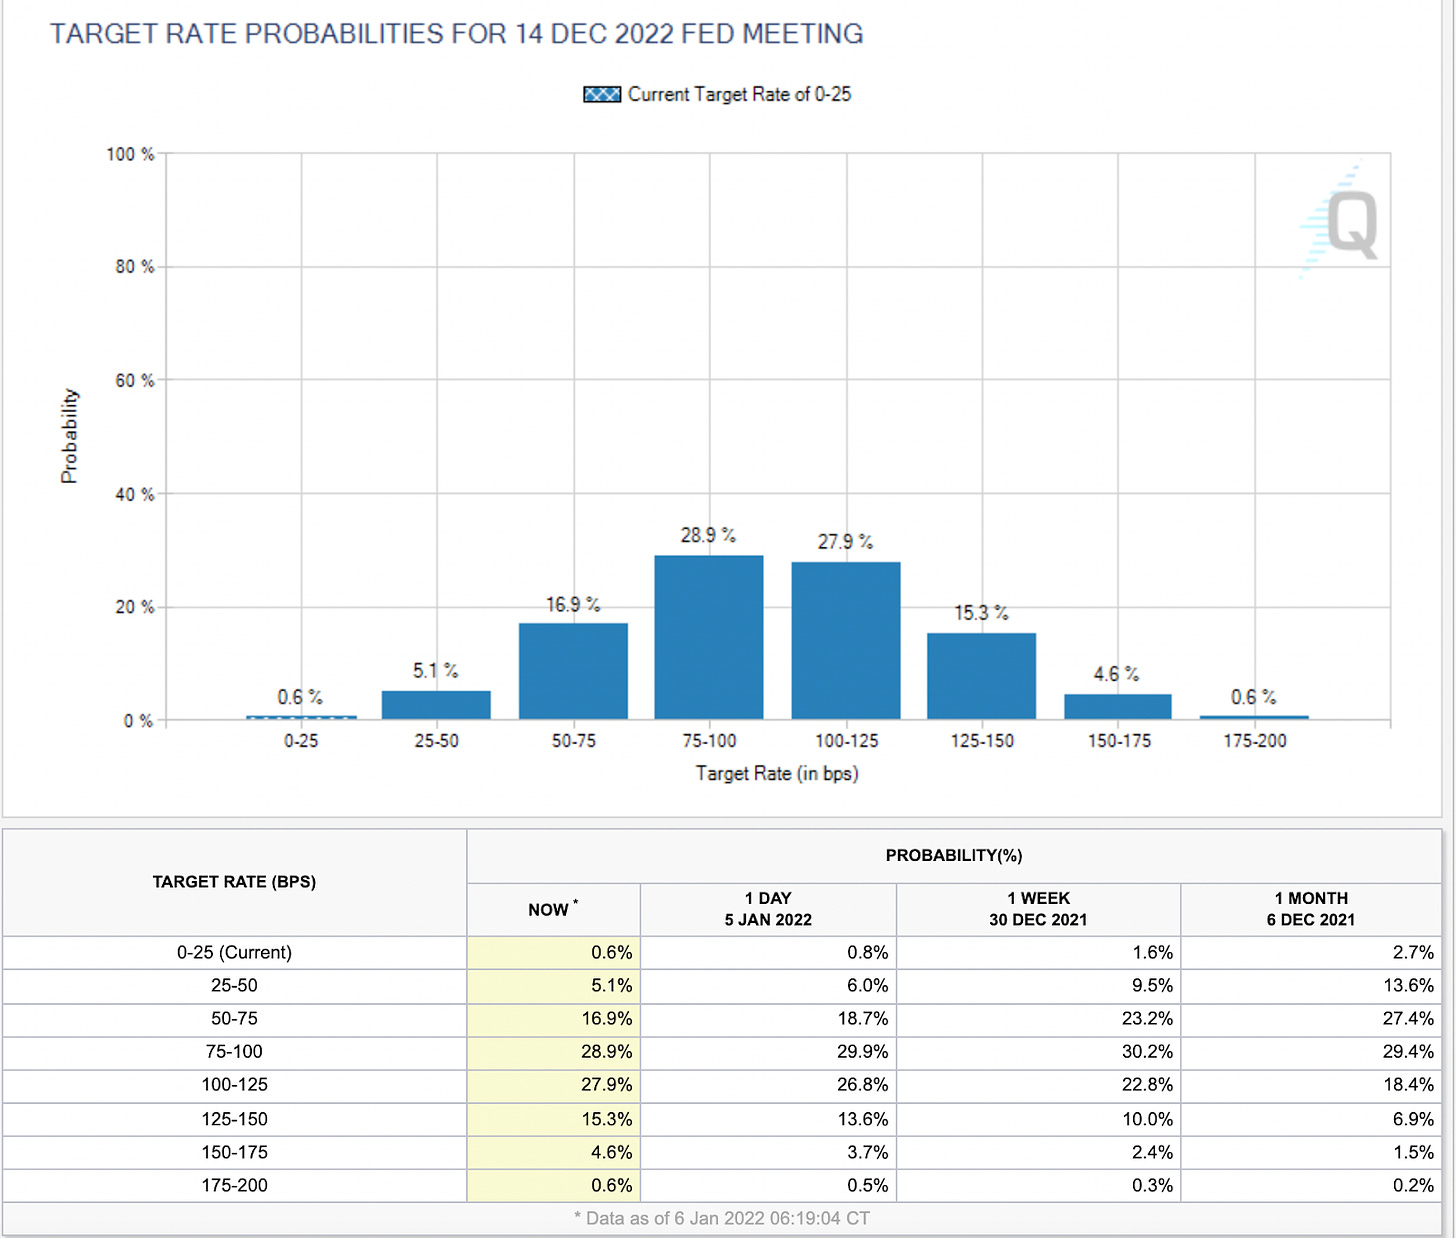
A month ago, the market was already expecting three rate hikes by the end of 2022. So it’s not as if this is completely out of left field.
The surprise is that we’ve gone from “possibly two, likely three hikes” to the assumption of “likely three hikes, possibly four.”
The other realization is that the Fed is likely to hike in two months, which previously stood at less than ⅓ chance a month ago to now a ⅔ chance today.
Put the two together and that’s worthy of some selling pressure I’d say and we’re getting it now. The question is, how much is needed?
Game Plan
Yesterday we kept it simple and wrote:
“The Game Plan is pretty straight forward: Keep an eye on tech/rates. Relief in these two areas should spell relief for the whole market. However, more pain could eventually tug the overall market lower.”
That’s pretty much the same thing today and we’re going to have to get much more selective.
The positive here is, we’ll see which stocks/industries hold up the best and which ones get swept up in the selling pressure. This relative strength will give us go-to names when the dust settles, whether that’s tomorrow, next week or next month.
Nasdaq
I hate being the “we said yesterday” guy, but if it remains true, why change it? In regards to the Nasdaq, yesterday’s Game Plan said:
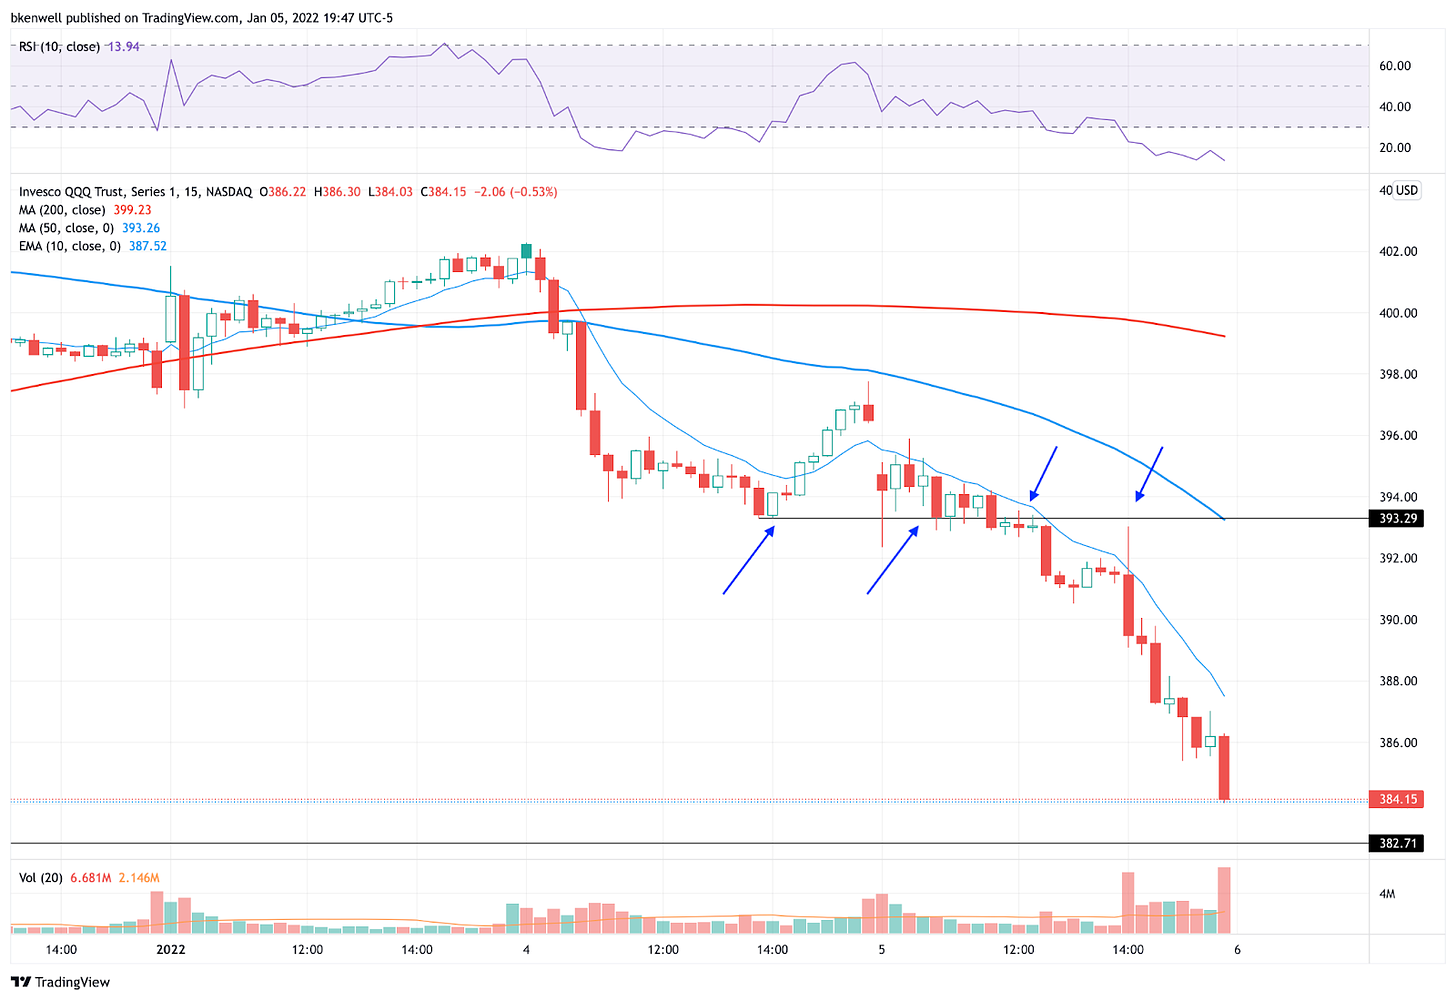
I don’t like to say there’s a “line in the sand,” but it feels that way with how the NQ futures and the QQQ bounced from the 50-day moving average on Tuesday. A break of yesterday’s low that’s not quickly reclaimed opens the door for more selling pressure.
The Nasdaq broke the prior day’s low (shown above on the 15-minute chart for the QQQ) and that level turned to resistance. It was a real-time intraday change in tune. The ranges have been wide, but if you’re being disciplined, it’s manageable — even when you’re on the wrong side at first!
So now what? Let’s take a deeper look at the Nasdaq, interest rates and our list of stocks holding up the best.
Keep reading with a 7-day free trial
Subscribe to Future Blue Chips to keep reading this post and get 7 days of free access to the full post archives.


