

S&P Bounces but Faces Key Upside Level
Can it break the downtrend or is it full of false hope?

Technical Edge —
NYSE Breadth: 59% Upside Volume
Advance/Decline: 53% Advance
VIX: ~$19.50
We’ve been looking for the oversold bounce + the bears to get caught offside. Now the S&P is faced with a key area on the upside. We had a nice maneuver on the S&P yesterday and NVDA paid well.
Let’s look at the setup for the rest of the week.
Note: Airline stocks reset nicely on the weekly charts and are trying to push higher. In fact, many names are set up quite nicely on a weekly basis. I will look to send an update in that regard, either today or this weekend (depending on today’s action).
TLT
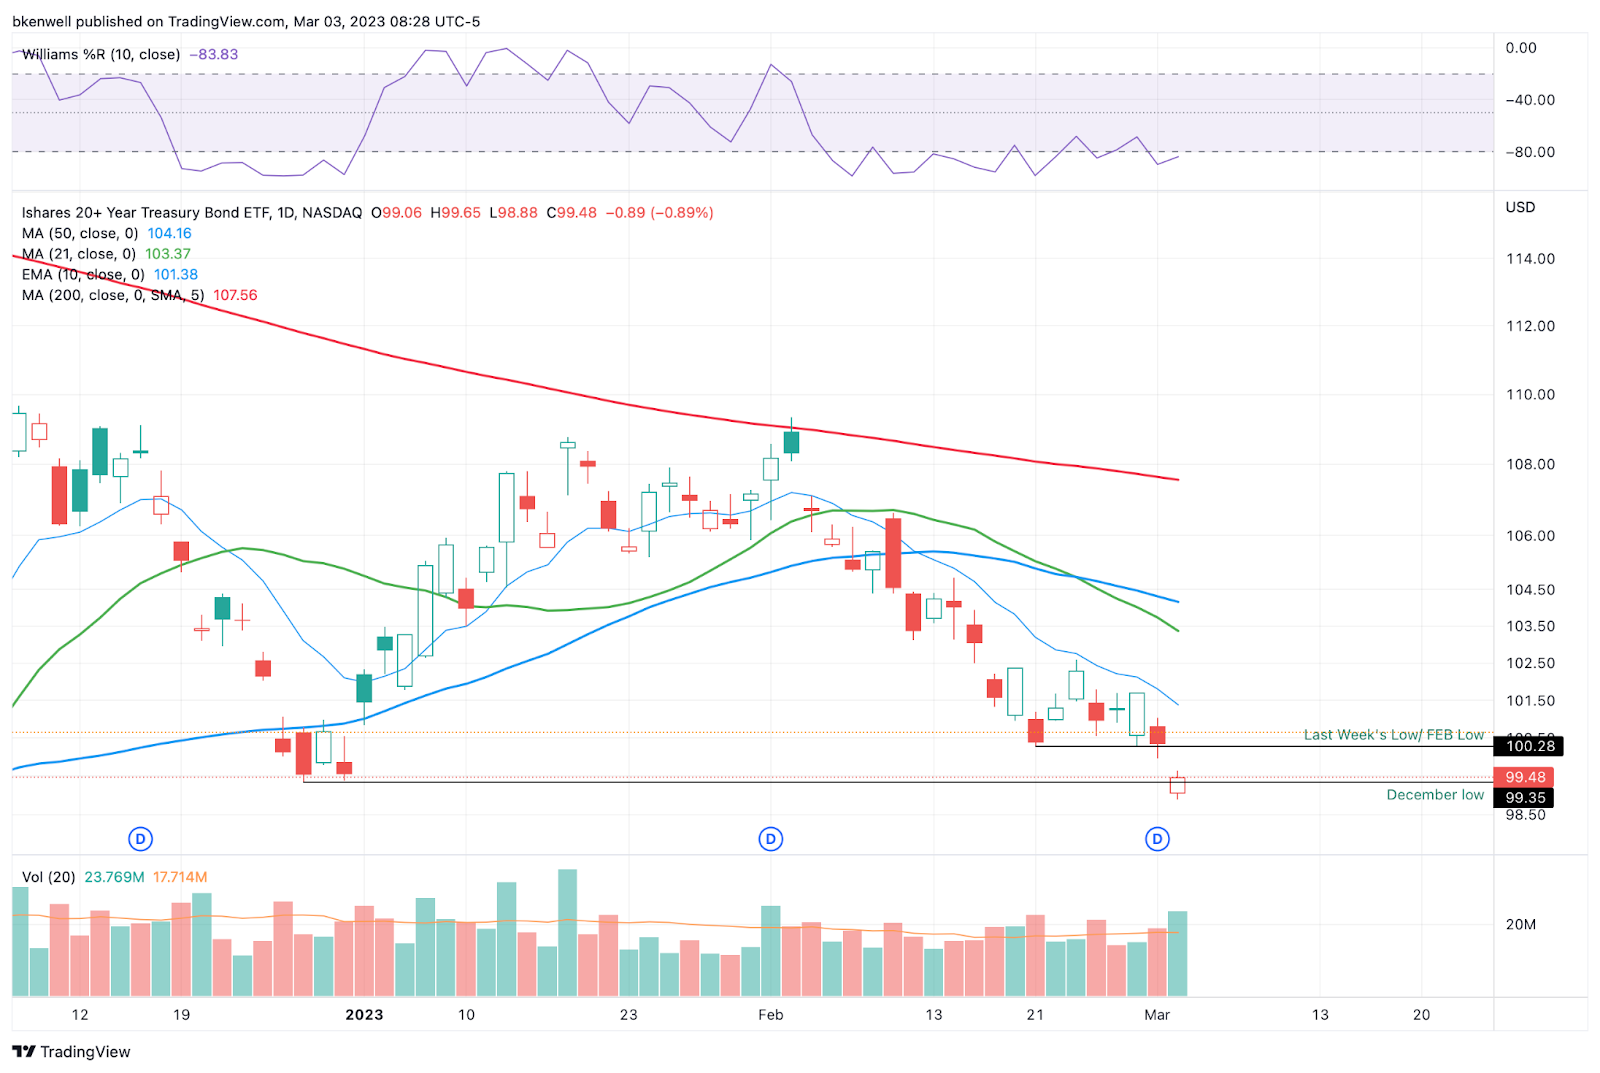
TLT is gapping significantly higher today, regaining the February low and last week’s low at $100.28 in the process.
If it can hold today’s gains (and grow them), it could and should bode well for equities.
That said, notice the trend, which has been completely to the downside. I expect resistance at the 10-day.
S&P 500 — ES
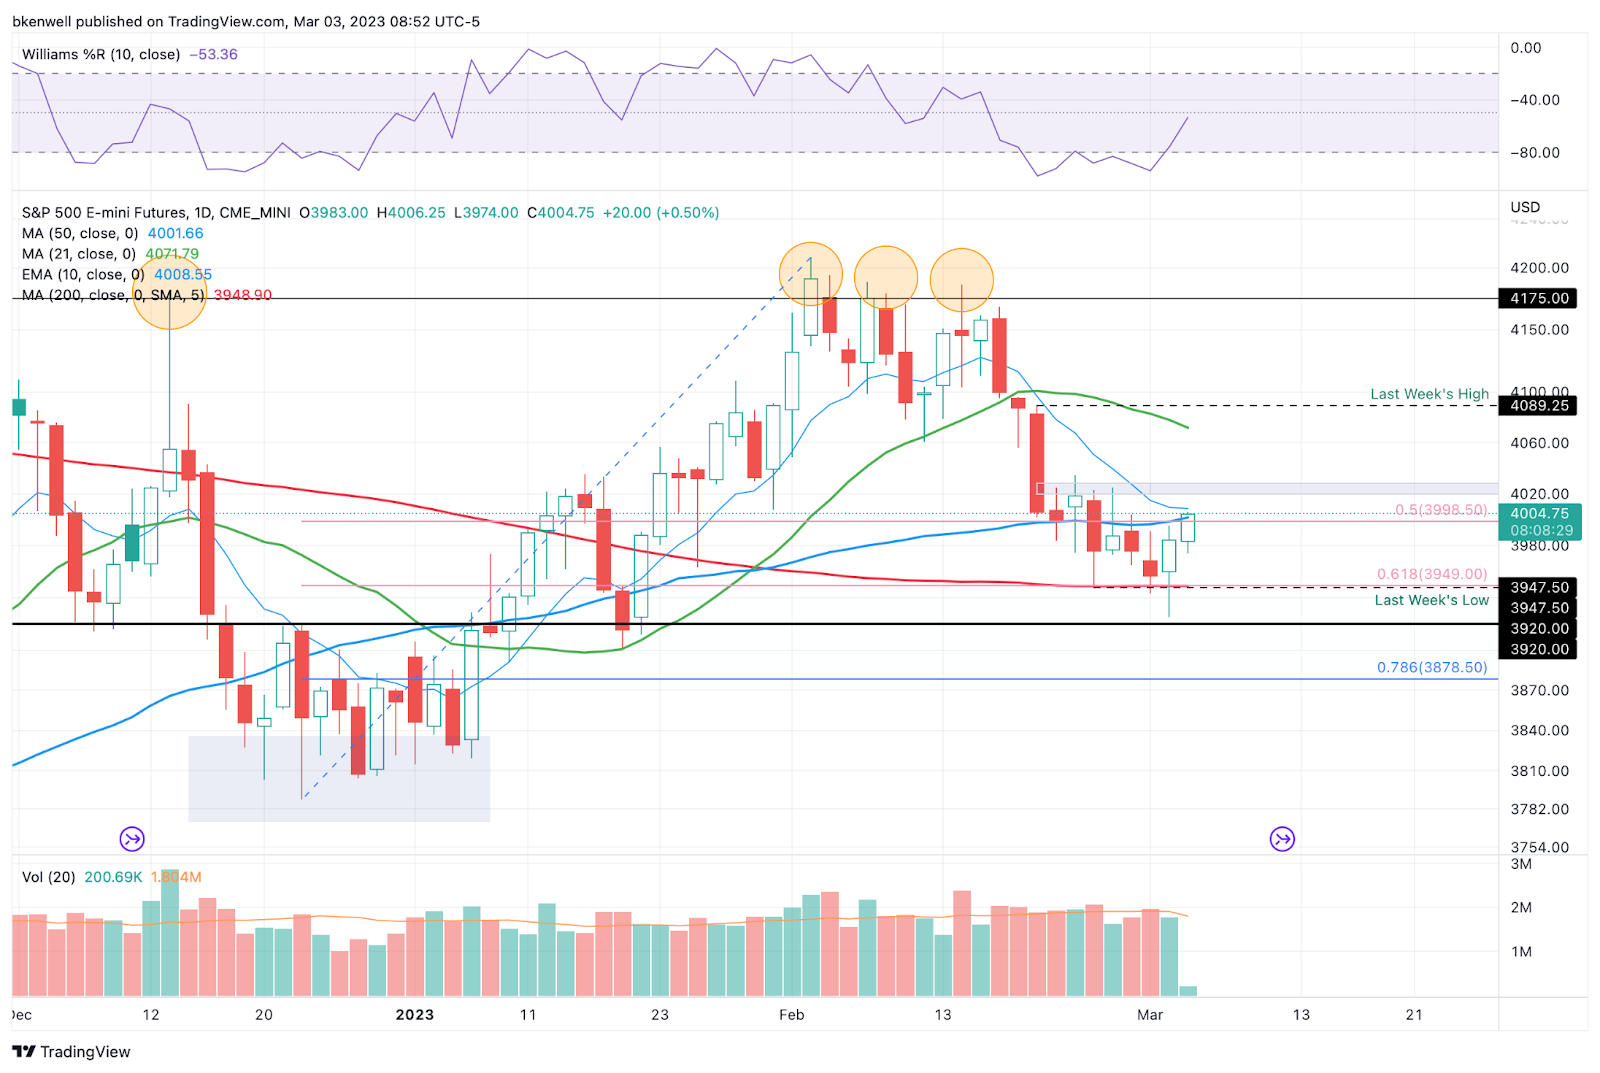
Yesterday we said, “I don’t think we’ll see 4000 today, but if we do see it this week, then I believe it will be resistance. It’s also where the 10-day and 50-day MAs come into play.”
Well, we almost saw that level yesterday as the ES tagged 3995. So far, this level is holding as resistance, but if the bulls can continue yesterday’s momentum, we could push through this level today.
On the upside, I am watching the 10-day ema, as we are on the 10th session since touching this measure. Above that puts 4020 to 4030 in play, which has been resistance since Feb. 22nd.
Basically, can we clear one resistance zone (4000 to 4005) and get to the next (4020 to 4030)?
On the downside, bulls want to hold the 3985 to 3988 area as support. If they don’t, then 3975, then 3966 are in play.
SPY
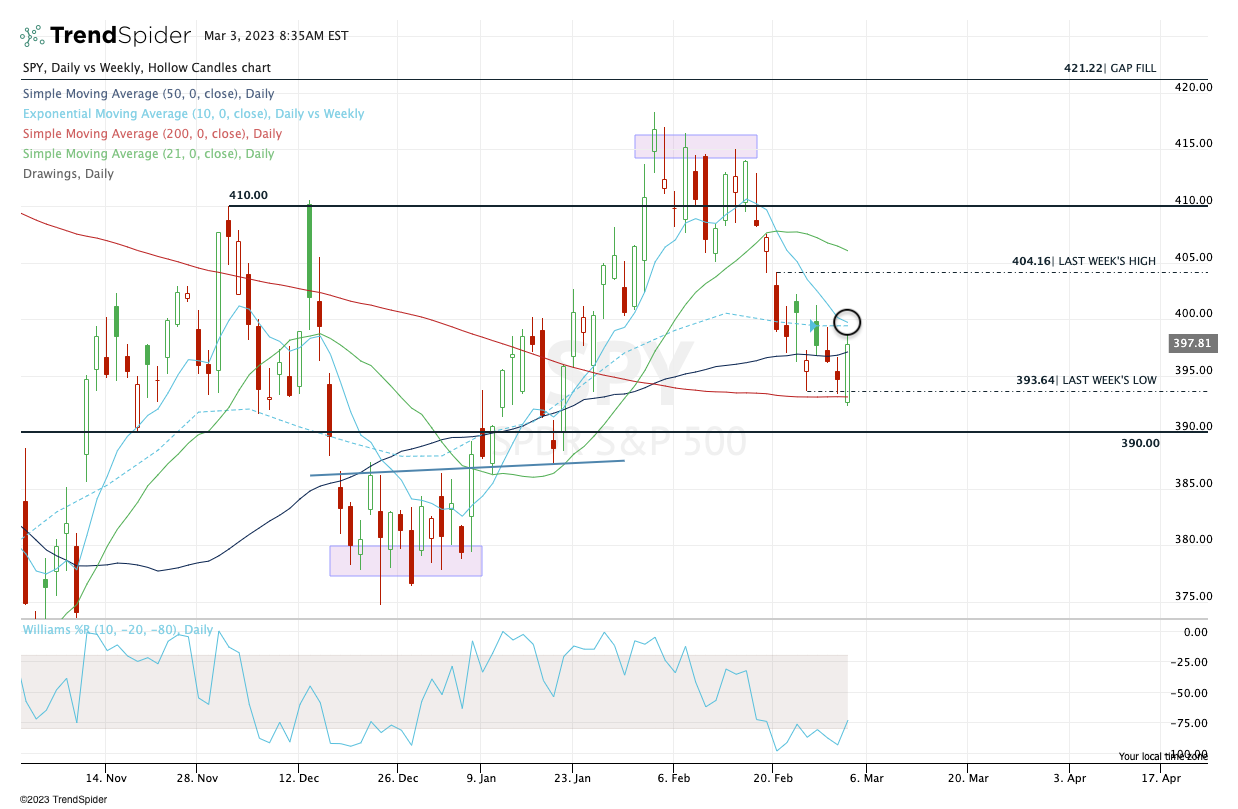
“The S&P is a bit oversold. If the S&P can regain yesterday’s low near $393.40, we could see a larger rebound ensue.”
The SPY bottomed at $392.30, regained $393.40, and pushed all the way to $398.70. That’s the type of trade we like to see.
I do think more upside is possible, but $400 is one heck of a test, IMO. There we find the 10-week and the 10-day moving averages, the latter of which we haven’t tested in 10 days now.
Clearly, we’re in a downtrend, but let’s see the reaction from the 10-day first.
~$404 is the 50% retrace of the decline and last week’s high. Below $396.50 is a negative development.
Open Positions
Keep reading with a 7-day free trial
Subscribe to Future Blue Chips to keep reading this post and get 7 days of free access to the full post archives.