Technical Edge —
NYSE Breadth: 68% Upside Volume
Advance/Decline: 66% Advance
VIX: ~$22
I hope your long weekend was a fulfilling one as we now kickoff a shortened trading week.
We have been reading about the Santa Claus Rally for what feels like the whole month of December. Well, for those interested, it’s actually defined as the last five trading days of the year and the first two trading days of the new year.
I would love to see the bulls regain some control, and while the stats for this time period are usually pretty good, it’s hard to argue that the trend has been anything other than bearish.
Let’s look at a few charts.
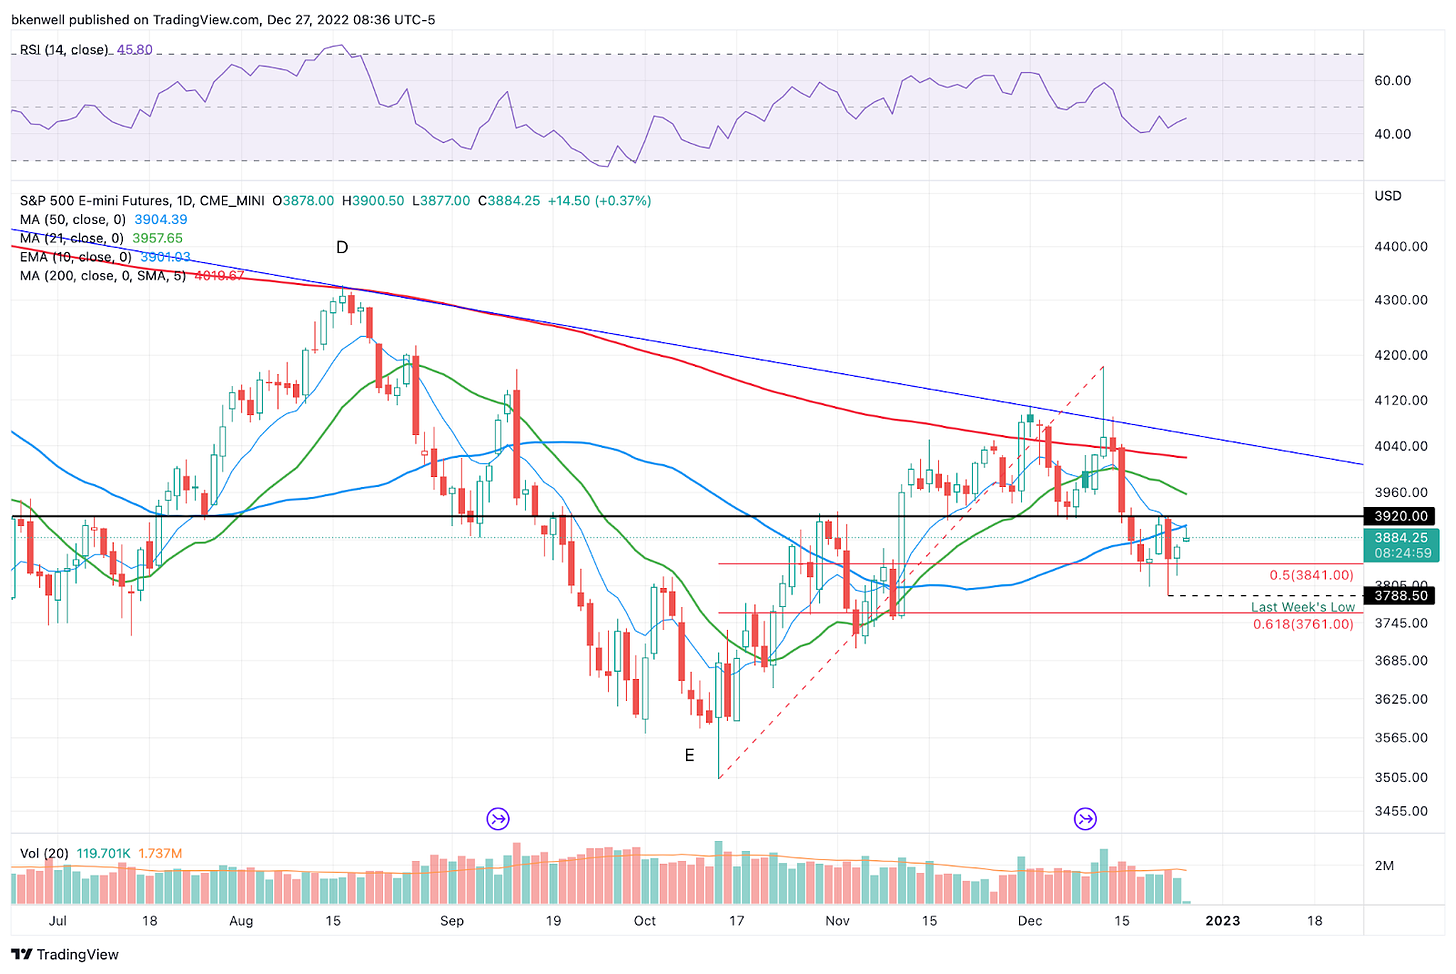
S&P 500 — ES
The ES is getting rejected by the 10-day moving average for the second time in as many sessions. There is technically a gap-fill down at 3872-ish. I would like to see that filled and see how the S&P responds.
The Globex high is up at 3900.50. A push back to that level opens the door for a potential cash-flow short, given the overhead and moving average resistance. If the ES does push through though, 3920 is in play.
On the downside, a break of 3872 without bouncing could put 3845 in play, then 3820 to 3825.
SPY
Keep reading with a 7-day free trial
Subscribe to Future Blue Chips to keep reading this post and get 7 days of free access to the full post archives.


