Technical Breakdown — Strong Breadth Continuation Day
NYSE Breadth: 61.8% downside volume
NASDAQ Breadth: 46.2% downside volume
The question now becomes, do we get a Day 3 — that is, a third follow-through day — or will there be some chop?
Well, we did get a Day 3 follow-through rally with the initial gap-up. Then the market mellowed out a bit after that. It was a great multi-day rip and now it becomes a question of whether the market does some back-and-fill here (with Opex next week and a short trading week) or if it powers higher like it did on the last pullback.
Game Plan
This is not the market we have been used to over the last 12 to 24 months. Old tech is beating growth tech (IBM, ORCL, CSCO, HPQ, etc.) Energy stocks are dominating. Financials are doing pretty well (and start to report earnings tomorrow) and so are value stocks like PG and KO.
Our goal as traders is not to get married to a certain group, but to find the ones that have momentum and trade the best setups.
I understand that these aren’t the “most exciting” stocks, but making money in the stock market is what matters in this context and it’s what we’ll continue to do.
If the stocks on your radar aren’t doing well, find a different radar!
S&P 500
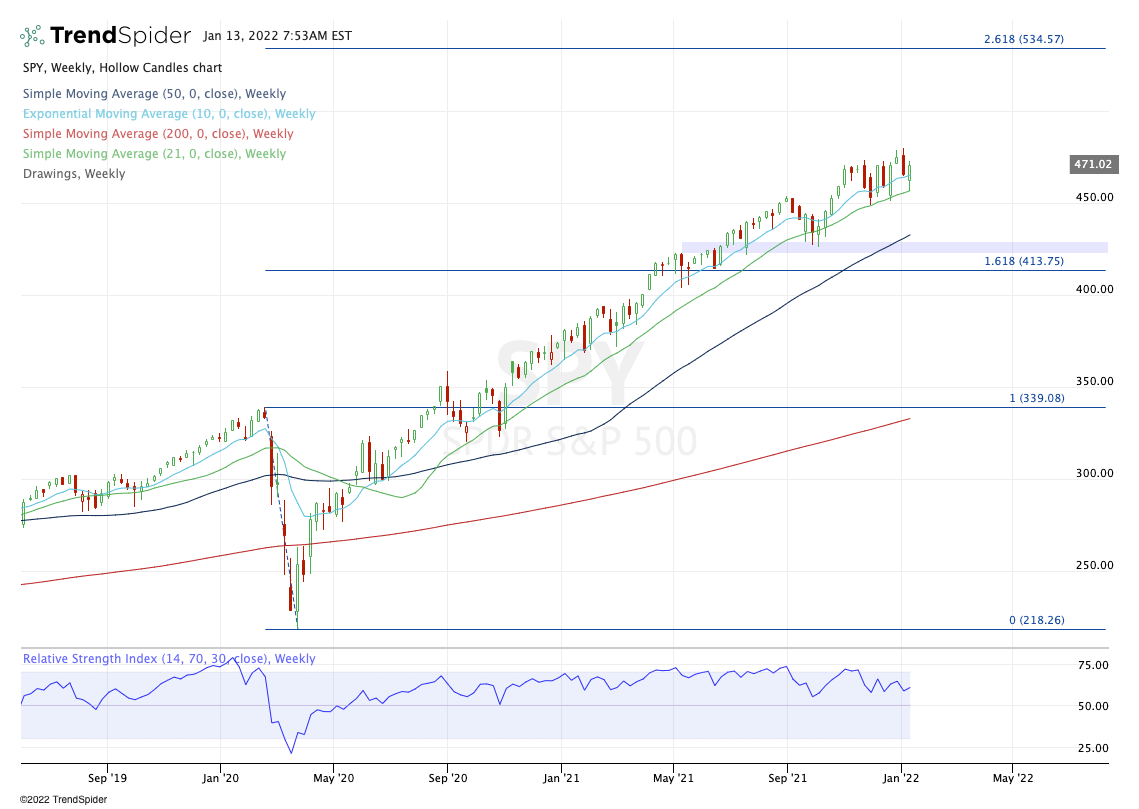
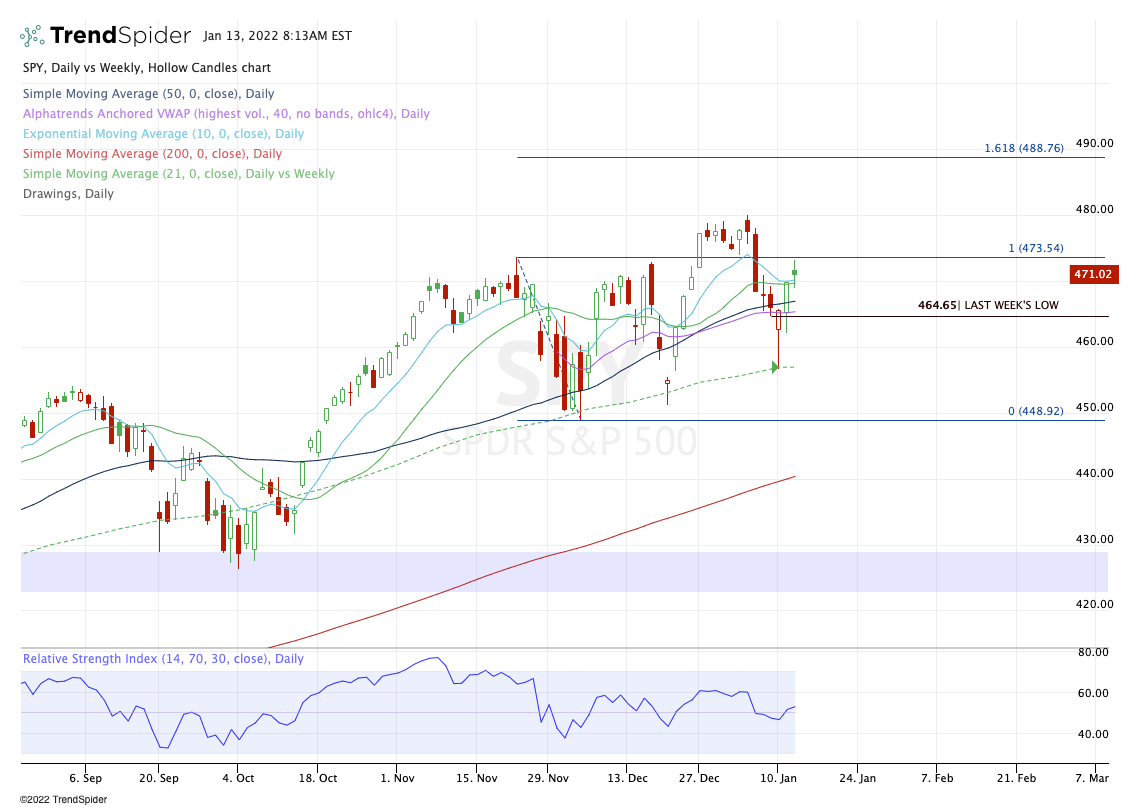
Above is a weekly chart and below is a daily. Both are of the SPY. Two things are evident to me when I look at this chart.
The trend is still intact and has been ridiculously strong.
At some point, we have to wonder when — not if — we get a deeper dip.
The reality is pretty straightforward. Over the long-term, stocks favor the upside, rising roughly four out of every five years since the 1950s. That said, we haven’t had a 10%-plus pullback since March 2020.
As we close in on two years from that point, I think it needs to be in the back of our heads that it’s possible we experience a larger dip this year.
A 10% to 12% correction would be healthy, but it doesn’t have to wreck the trend. For example, if it happened right now it would take the SPY down to the 50-week moving average and possibly the Q4 lows.
When we look at the chart above, there could still be more upside — possibly up to the 261.8% extension. However, as we continue to ride the 21-week moving average, consider how many times it has tested this measure in the last six weeks vs. how many times it tested it prior to Q4 2021.
That’s waning strength, in my opinion. Again, it doesn’t mean the rollover will happen tomorrow. But it’s something to store in the back of our mind.
The bottom line from the weekly view is that the trend may be waning but it’s still intact.
When we look at the daily, we see the SPY is up big from this week’s low and it’s also back above all of its daily moving averages, the daily VWAP measure and last week’s low at $464.65.
In the short-term — i.e. today — I’m keeping an eye on yesterday’s low. If the SPY loses this mark, it will also lose the 10-day and 21-day moving averages, putting the 50-day and last week’s low in play.
To lose all of these levels puts this week’s low back in play.
On the upside, a sustained move back over the $473.60 area could open the door to the $477 to $479 area.
Individual Stocks — Scouring the Leaders After Some Nice Wins
We had an incredible couple of trades yesterday.
ARKK faded from resistance right on cue, while GM actually gave us the undercut of the lows we were looking for and we were able to take a huge reversal with it as it bounced hard from the lows.
When we get a couple of nice wins, it lets us sit back a little bit and get even pickier for the next setups. Speaking of which:
Keep reading with a 7-day free trial
Subscribe to Future Blue Chips to keep reading this post and get 7 days of free access to the full post archives.


