So far, this is the intermediate-term correction that we were looking for. August and September are the weakest two-month stretch for the market, so it’s no surprise that we’re seeing this mild pullback now.
The risk is that “mild” turns into something more severe.
Notice how we have avoided new individual stock setups all month long (with the exception of XOM, as energy continues to trade pretty well). That is/was in anticipation of some seasonal weakness. If the market holds in and pushes higher, we can start to look for some rotations as well.
Now sitting at intermediate-term support (AKA, using the weekly charts) and it’s key that the market holds this area.
We’re not falling apart per se — for instance, many investors may be overlooking the fact that the Nasdaq is actually up so far this week. However, if the market can’t hold in this week, our standard 3% to 5% correction could turn into something bigger.
Until that happens though, we must respect the larger trend that has been in play. While the short-term trend is bearish, the intermediate-term trend is bullish. Until that fails — meaning support breaks and then turns into resistance — we must respect the larger trend that is in play.
Technical Edge
NYSE Breadth: 15% Upside Volume (!)
Advance/Decline: 16% Advance (!)
VIX: ~$16
SPY
Daily chart, then a 4-hour chart.
Yesterday’s action was a bit ugly, but as the daily chart shows, the SPY is still technically okay. It’s holding the major levels — 10-week ema, 61.8% retracement, etc — but at the same time, yesterday’s close felt as if it deliberately took out last week’s lows…
…However, we did get the gap-fill at $443 (from July 11). After declining in 8 out of 11 sessions — and really more like 9 out of 11 — can the S&P get more than a dead-cat bounce going?
Upside Levels: $443, $448, $451 to $451.50
Downside Levels: $442 to $443, $437.50
SPX
Gap-fill, 61.8% retrace, 10-week ema. If the SPX is going to bounce, this would be a good spot for it to find its footing.
Upside Levels: 4458-64, 4480, 4500, 4527.50
Downside Levels: 4435-44 (wide range), 4400, 4385-88
S&P 500 — ES Futures
We broke that collection of lows between 4460 and 4470 and now bulls are tasked with regaining this area — and quick.
If they don’t, the charts turn decisively more bearish, opening the door down to 4425 and possibly lower.
On a rebound, look for that Q2 high to act as resistance intiailly, in combination with the 50-day and 10-day moving averages…call it 4485 to 4493, with an overshoot putting 4500-03 in play.
(Remember that our 4493-4503 area has been vital).
Upside Levels: 4485-4493/4500-4503, 4512-15, 4540-42, 4550-60
Downside levels: 4447, 4425, 4370
Weekly still looks fine though:
NQ
You may not believe it, but the NQ is actually up for the week and the weekly chart still looks okay. That narrative changes if we break and stay below 15,000.
15,300 remains a hurdle, but as long as that 15K area holds, bulls are okay. A sustained break opens the door to the 14,750 to 14,850 area.
Upside Levels: 15,300, 15,450-525
Downside levels: 15,000-30, 14,750-850 (admittedly a wide range)
QQQ
So far, this correction isn’t a disaster, but it’s building up some upside hurdles. For the QQQ, the first hurdle is at $370 to $372.
$363.75 to $364.50 is very key on the downside.
Upside Levels: $370 to $372, $374.50
Downside levels: $363.75 to $364.50, $360
UNH
I have a small long in UNH and have been waiting for an upside rotation through $513 to $515 for weeks now. It tends to open strong, then fade, but if the markets turn higher and UNH gets going up through this zone, a move into the $530s could be next.
A riskier play may be buying the dips down into the low-$500s, but that’s a RORO setup — Right or Right Out.
Sub-$500 is the risk, so a weekly rotation has a bit more at stake from a risk perspective, so keep that in mind in regards to position size. Calls or call spreads could work well in this case, likely with the September expiration.
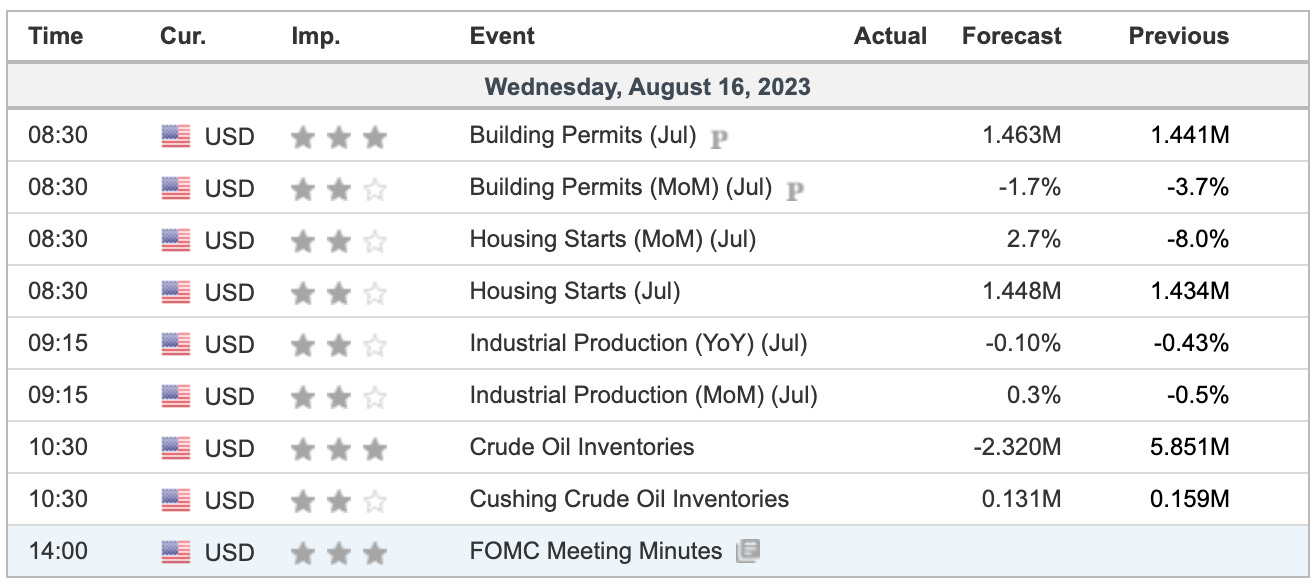
Economic Calendar
Disclaimer: Charts and analysis are for discussion and education purposes only. I am not a financial advisor, do not give financial advice and am not recommending the buying or selling of any security.
Remember: Not all setups will trigger. Not all setups will be profitable. Not all setups should be taken. These are simply the setups that I have put together for years on my own and what I watch as part of my own “game plan” coming into each day. Good luck!
Keep reading with a 7-day free trial
Subscribe to Future Blue Chips to keep reading this post and get 7 days of free access to the full post archives.


