Technical Edge —
NYSE Breadth: 83.5% Downside Volume (!)
NASDAQ Breadth: 71.5% Downside Volume
Call it what you will, but we were pretty lucky yesterday. On Wednesday we got a number of exits on our long positions and came into Thursday saying, “I’m pumping the brakes here for a day on new trade setups.”
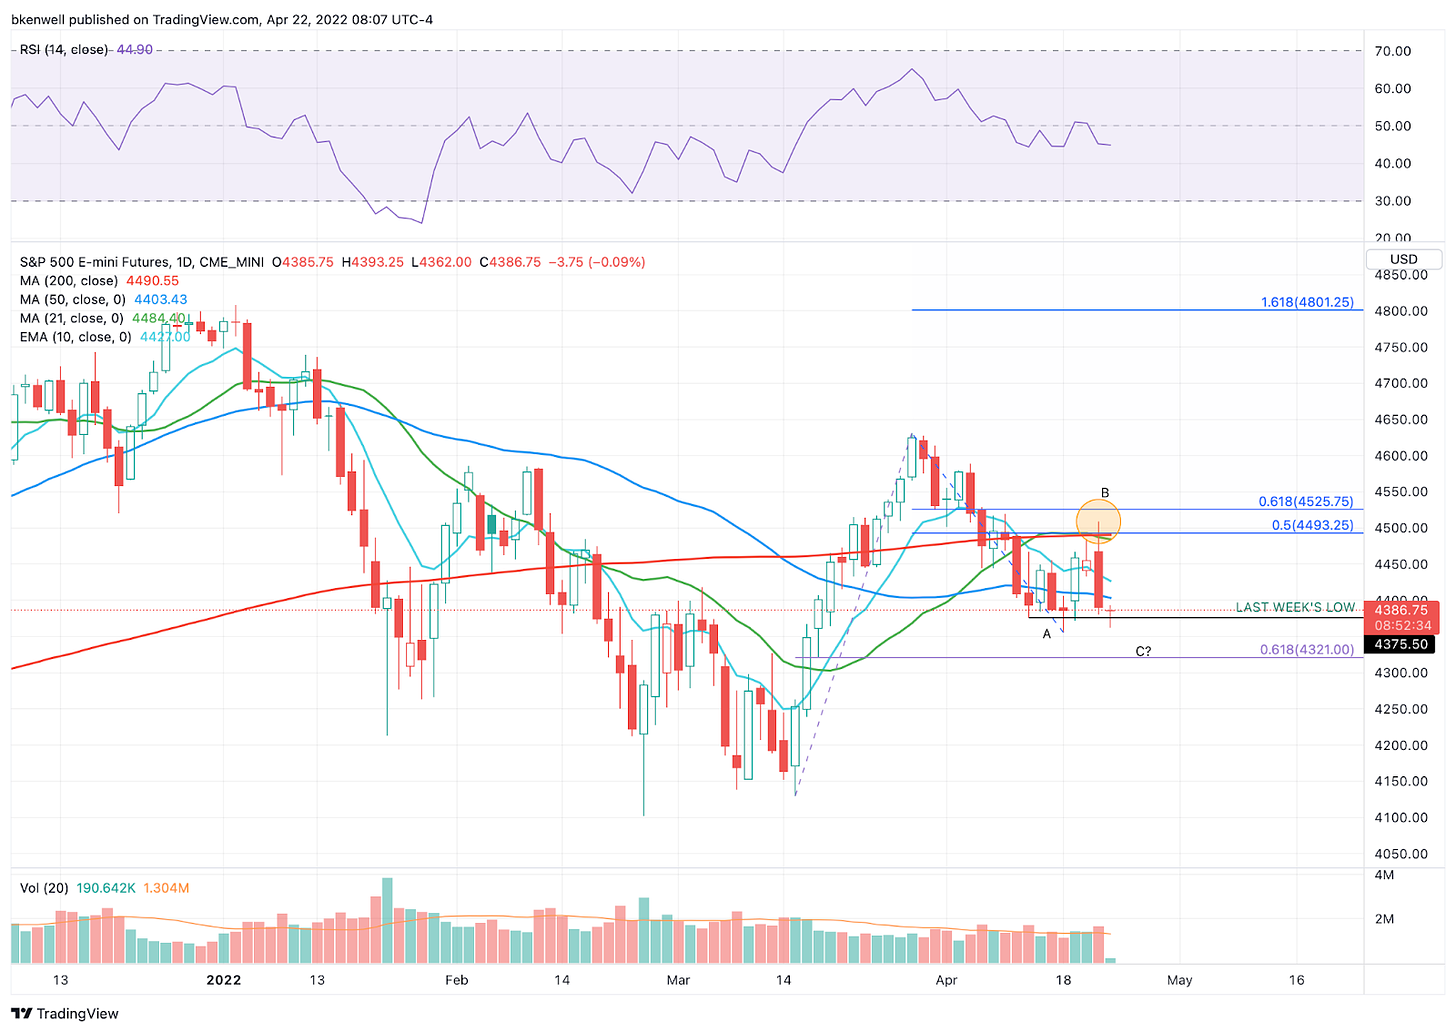
That said, this market has been tough even when the roadmap is laid out correctly. We had flagged the 4500 level in the S&P 500, where it found the 200-day, 21-day and 50% retracement.
And even though the downside was mapped to 4410 — as the ES fell all the way to 4380 — I certainly didn’t expect the market to fail in such a spectacular fashion and did not capture a bulk of the decline. Ugh.
That’s okay. Onto the next.
Game Plan
My suggestions in this tough market would include:
Take a few days off and do something you enjoy and/or just take a few days off from trading and simply watch the markets without trading (if you’re struggling).
Trade smaller size. This helps a ton, mentally speaking!
Look at the relative strength list we provide at the bottom. These stocks are in uptrends, seemingly oblivious to the carnage around them.
WMT, TGT, DOW, AMGN, MCK, ABC, etc. continue to ride their trends higher. That’s not to say they will forever, but get rid of the desire to trade TSLA, AAPL and the other favorites all the time. New leaders are in play right now. Until that changes, this is where the money is at, in my opinion.
S&P 500
Thursday morning we were going weekly-up. Thursday’s pm Globex session, we were going weekly-down. I can’t reiterate enough how tough these market changes have been.
The best way to approach this market is with a “two-way” mindset. I know that’s hard, but if you can trade the market like that, the levels are fairly straight forward. Look at where the S&P failed yesterday: a trifecta of resistance.
Now trying to stay above last week’s high, I’m definitely cautious of this market. I think we need some downside breadth flushes that really gets us toward a capitulation situation.
On the upside, watch 4405 to 4410 and the 50-day. Above that opens the door up to the 10-day moving average, then 4435, followed by 4445 to 4452.
On the downside, this week’s low is on watch from Monday, down at 4355. Below that opens the door to the 61.8% retracement down near 4320.
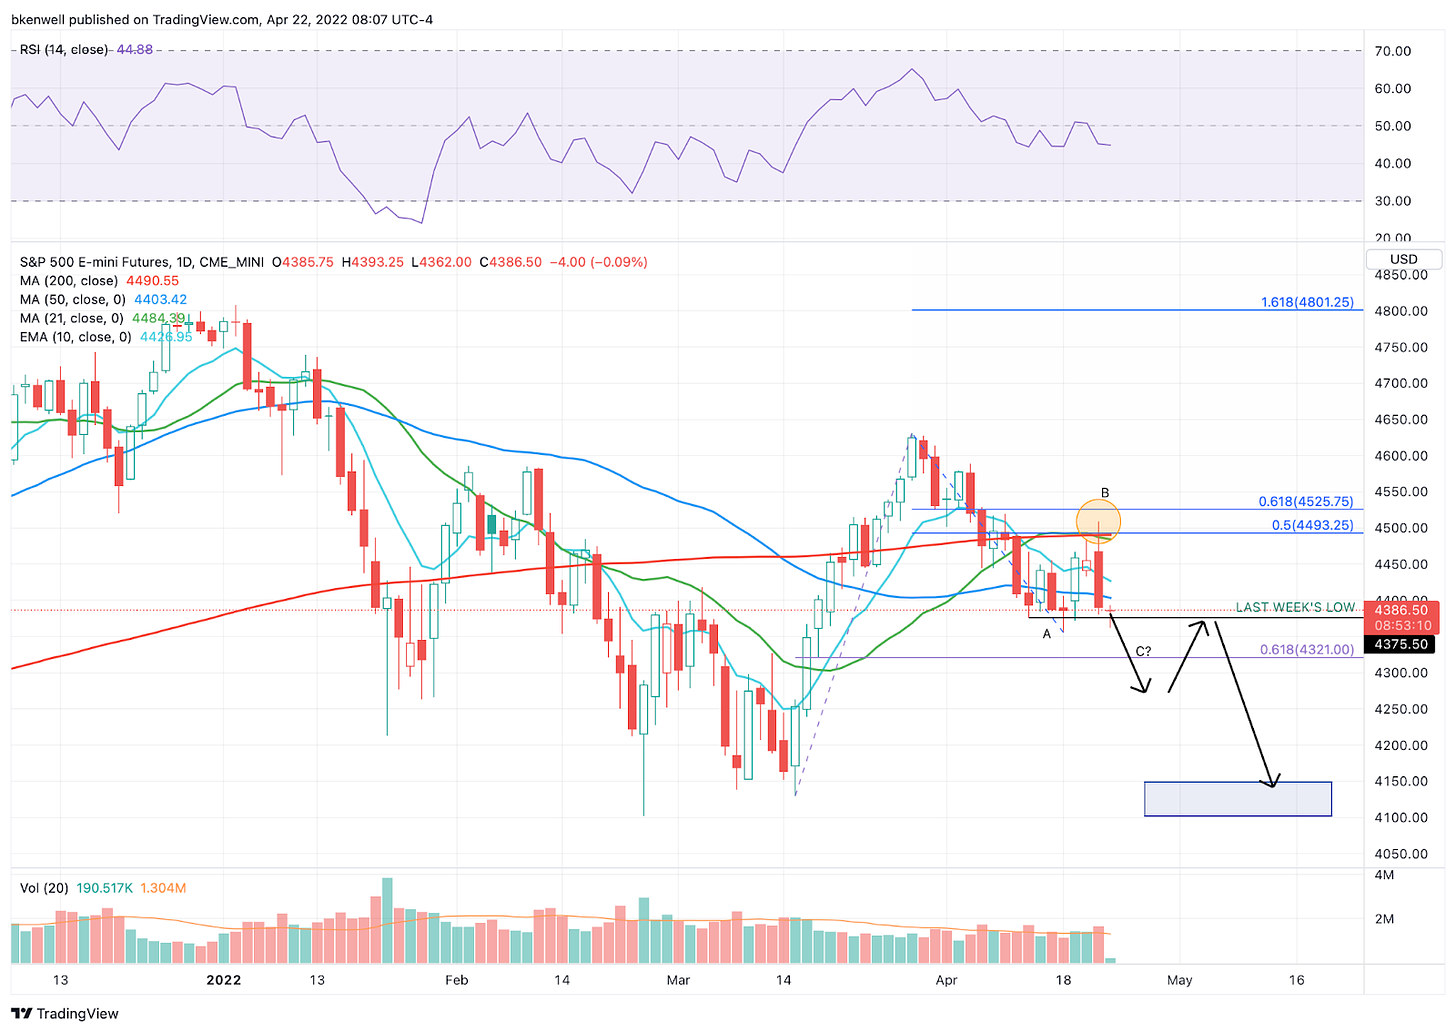
Could this be one scenario:
This is mostly just me thinking out loud and sharing it here. It’s not a day-by-day prediction. I am simply looking at the patterns. One reason we expected resistance near 4500 to 4525 was the ES’s recent tendency to trade in ABC or ABCDE waves.
With the Fed tightening the way it is, I don’t think we can rule out a test of the lows. This is one five-wave scenario that would get us there.
Bonds
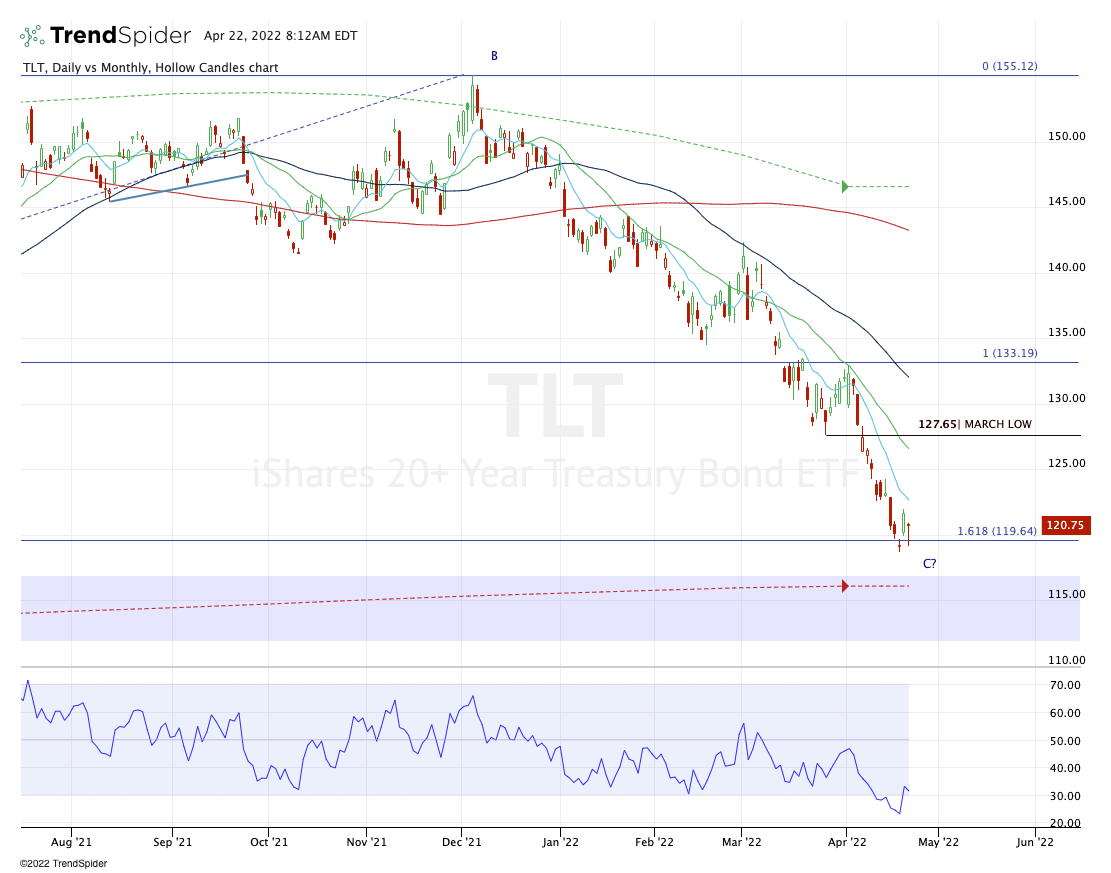
The TLT has been trying to find its footing down here.
On the upside, watch the 10-day moving average as resistance and potential short opportunity if it can’t close above it.
On the downside, a break of this week’s low at $118.67 could put the 200-month moving average in play.
Individual Stock Trades
Careful with these and size right. With volatility climbing, we could see some very whippy action.
TSLA
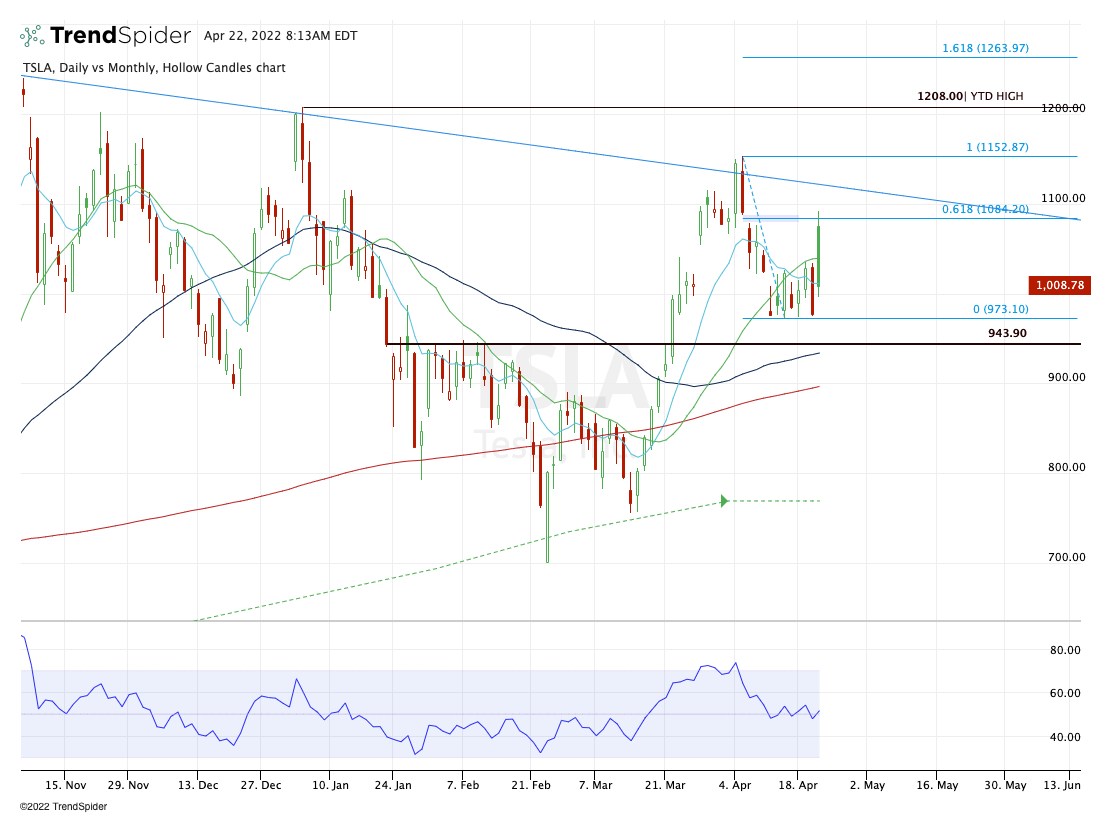
Tesla faded right from that $1,085 spot.
Above the 21-day and bulls may be back in control. On the downside, $975 is key. Below that puts $940 to $945 in play next.
NEM
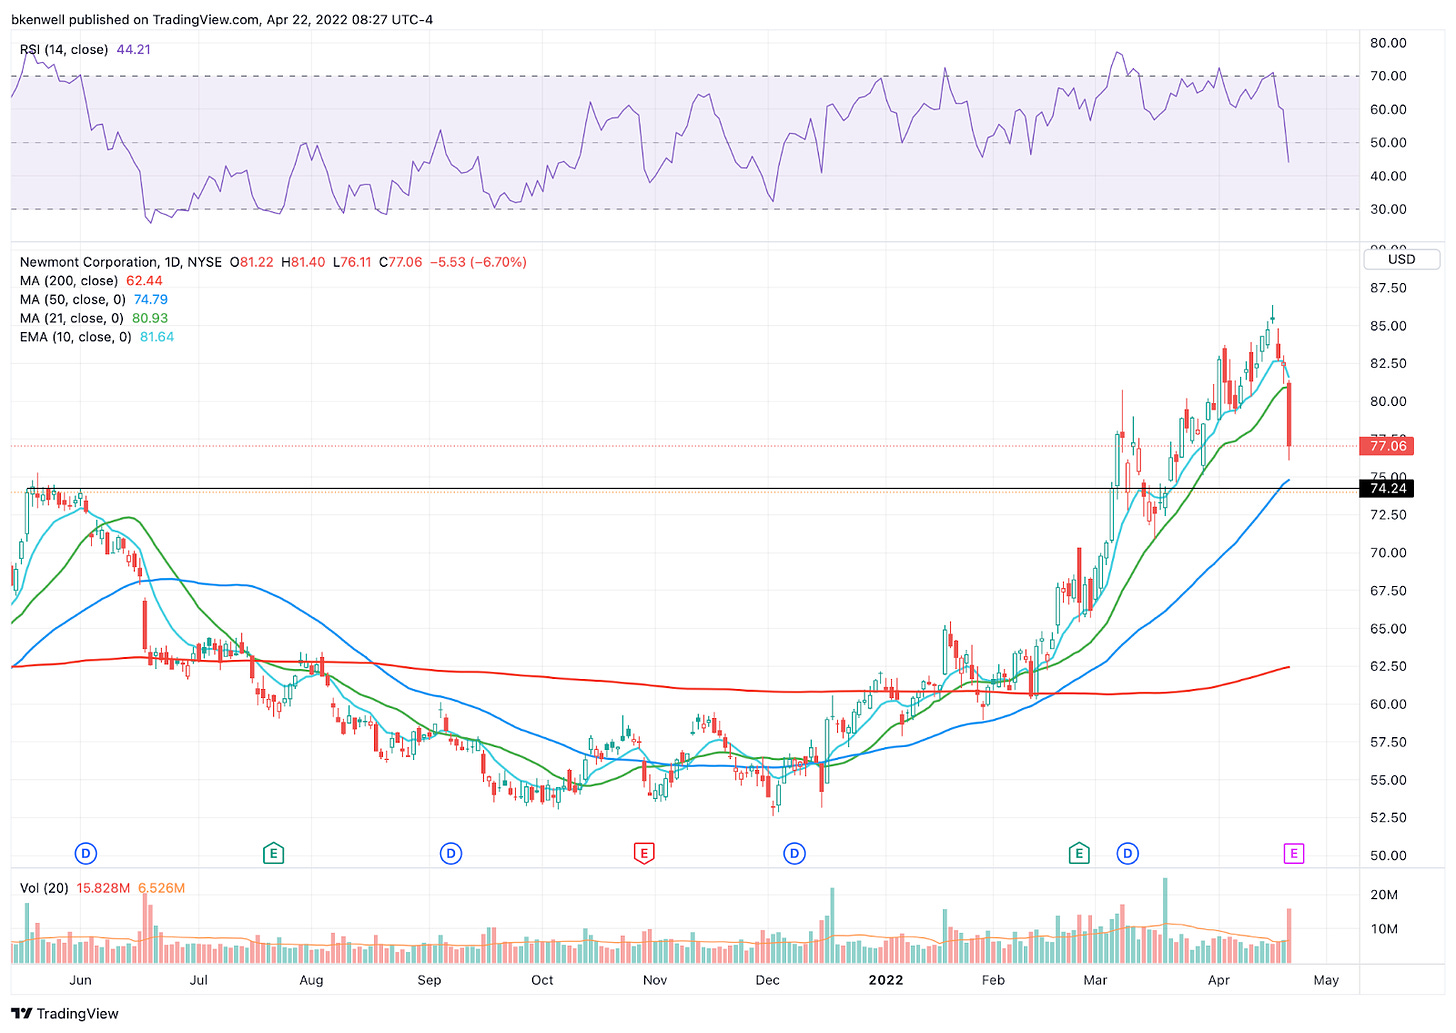
This may be a decent lotto — so size it as such if that’s how you’re trading. EPS this morning and down about 4% in pre-market trading after yesterday’s 6.7% dip.
Set to open near its 50-day and prior high, this prior Relative Strength leader could give us a bounce this a.m. That said, miners and precious metals have not been great lately.
AR
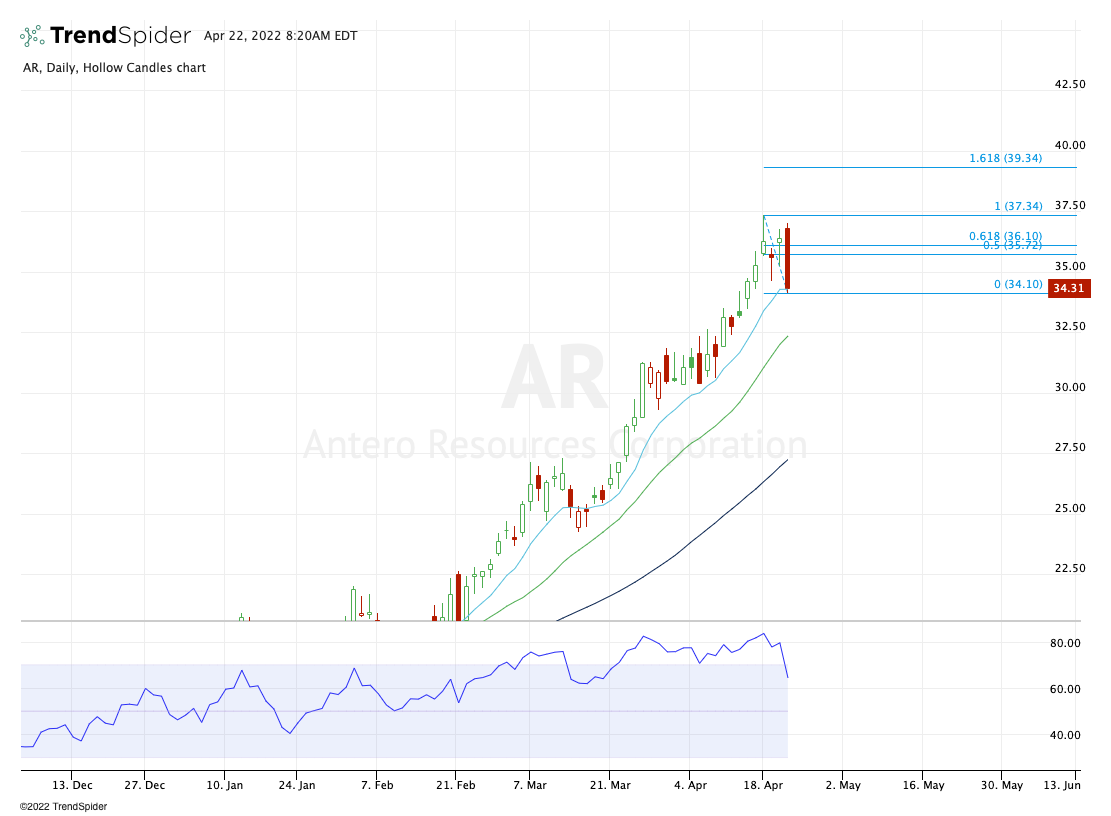
Right into short-term support.
If it holds, look for a bounce into the $35.75 to $36 area as the first trim. $37 to $37.50 is the second trim.
If support fails, the $32.50 area is of interest. There we have a small breakout area, the 21-day moving average and last week’s low.
TGT
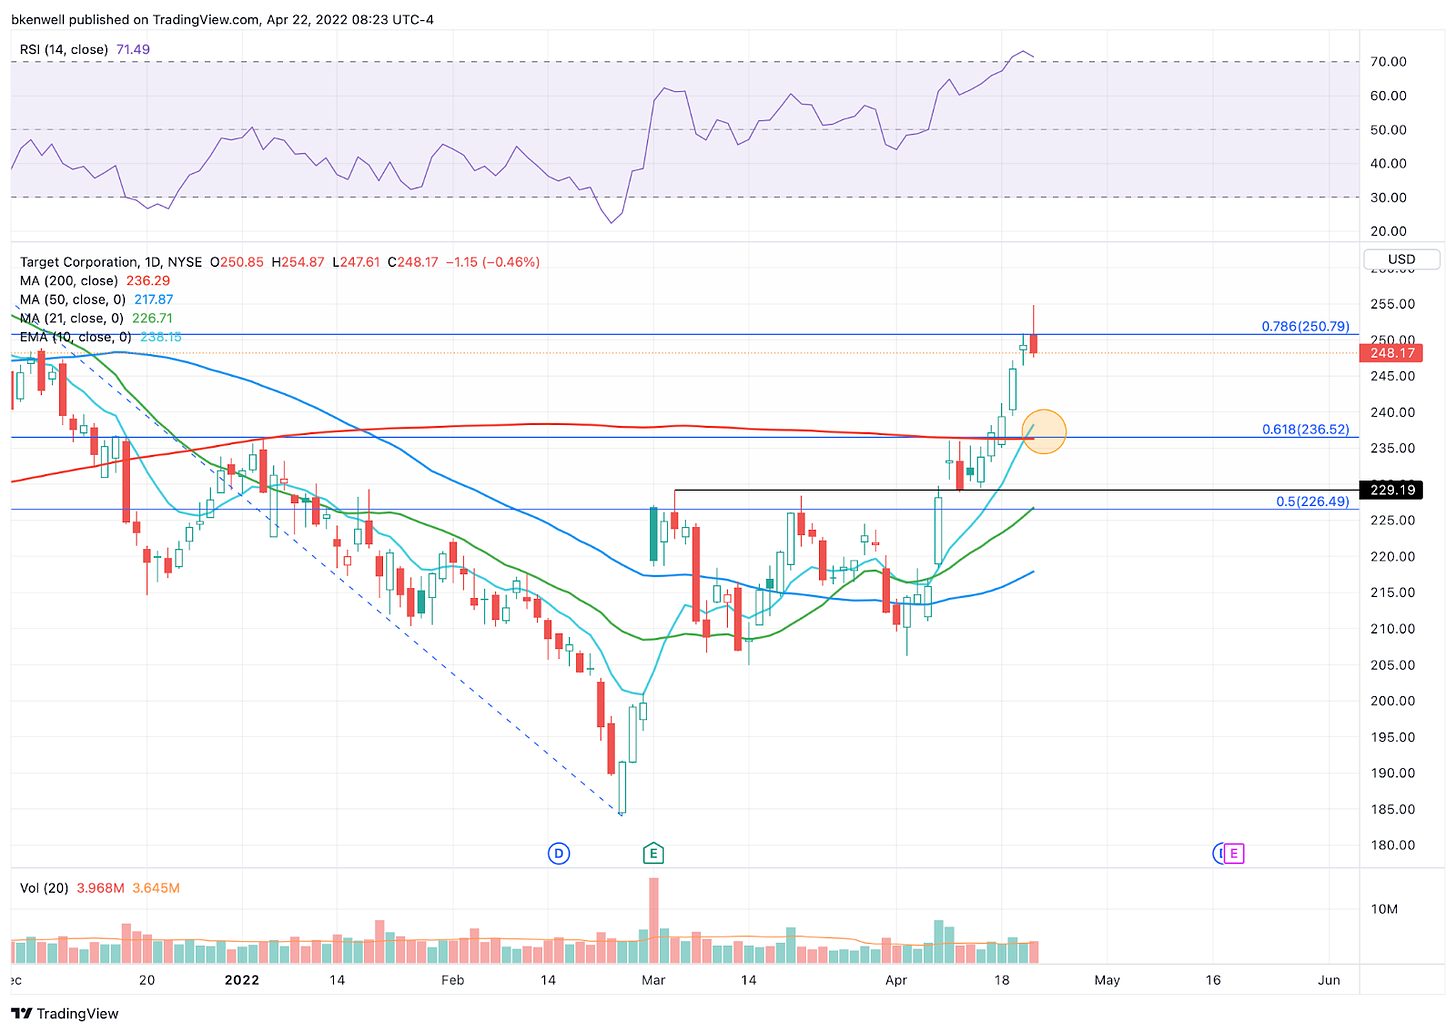
A big recent winner of ours (see below) where some members may still be carrying ¼ to ⅓ of their position, TGT might need a rest.
If that’s the case, keep the $235 to $237 area on your radar in the coming days.
DLTR
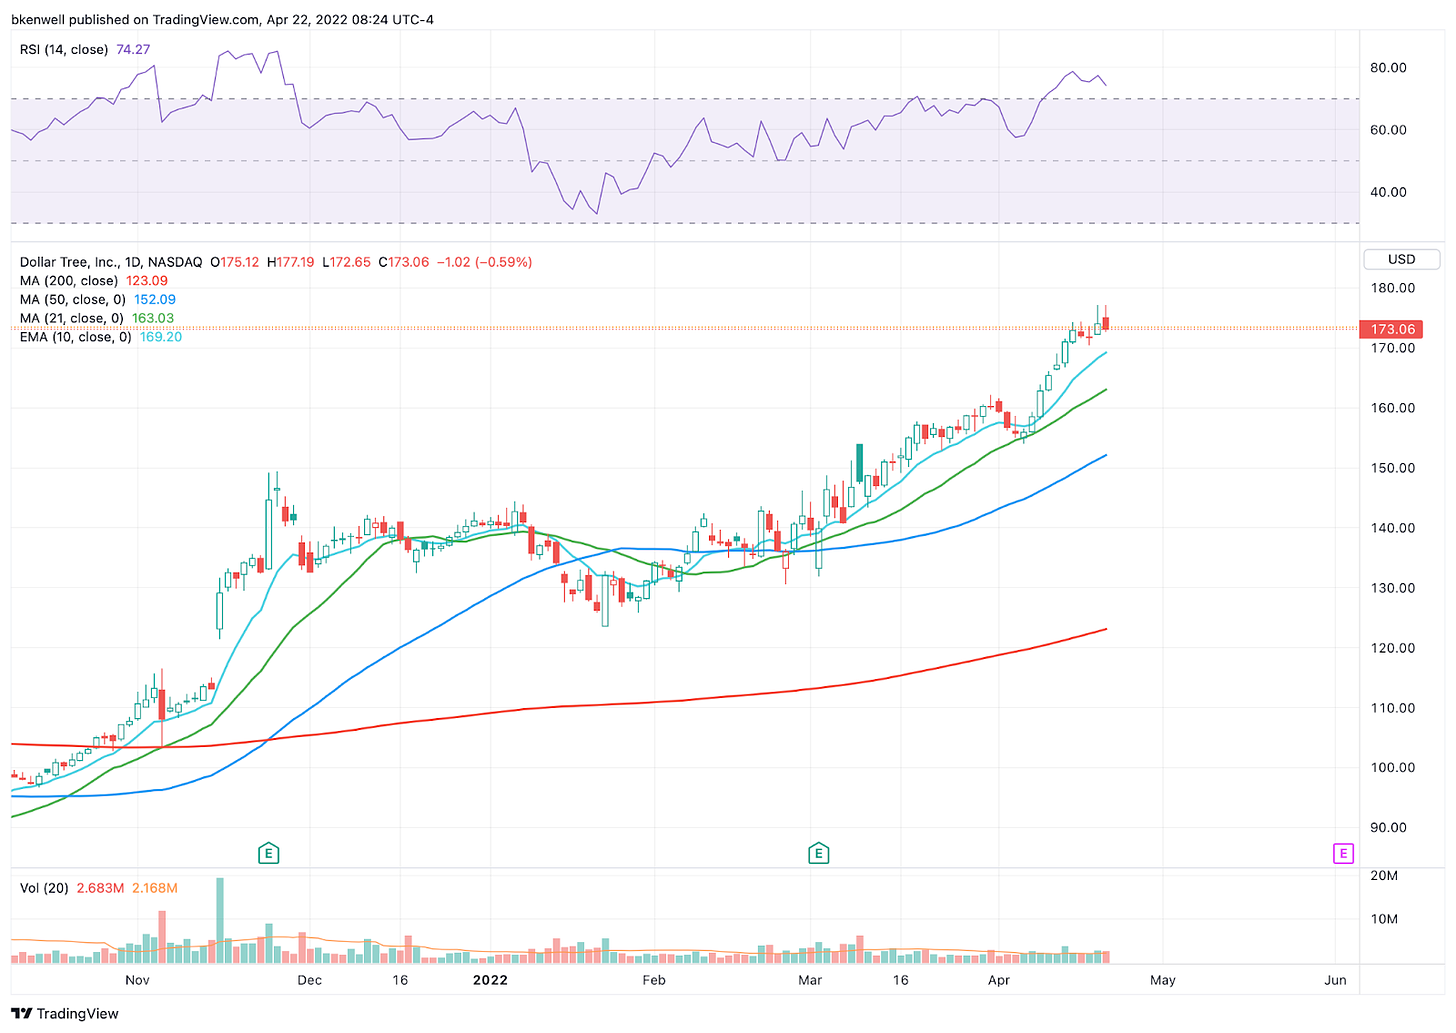
Another recent retail winner for us, watch the 10-day in DLTR. I want to see if this level acts as support, keeping the thesis alive that some of our retail leaders will continue working.
*Feel free to build your own trades off these relative strength leaders*
Numbered are the ones I’m watching most closely. Please look at these closely, as there are several updates (the most recent of which are noted in bold).
COP — stopped
VRTX — First trim zone hit → Next trim spot at $291 to $292.50 vs. B/e Stop
PANW — Trimmed into weekly-up area near $631. Still looking for $645 to $655 on the upside against a B/E stop (near $598)
TGT — $250 trim spot hit → A full exit is okay. Otherwise look for $265-ish on remaining ⅓ of position. Stop-loss either at B/E or raised to $235. Your preference.
WMT — Trim at $158 → B/E Stop. Inside week. Now looking for inside-and-up rotation over $158.29. If so, it puts $162 in play for small trim, otherwise $165 to $170 is our longer term target.
ABC — $166 Trim spot hit → $170 to $172 would be for the final tranche. Full exit is okay too. B/E stop is fine.
Relative strength leaders (List is getting longer!) →
AR — watch for test of 10-day
MAR — back on the list
CAT
DOW, NEM
DLTR
COST
MCK
BRK.B
XLB — ADM, NTR, CTVA, NEM, DOW — Keep an eye on this group in the coming days.
ABBV
FLR
JNJ
XLU
BMY
Energy — FLNG, XLE, APA, CNQ, CVX, ENB, PXD — etc.
PANW
AMGN
ABC
UNH
VRTX


