

So Far, It Looks Like a Standard Pullback
10-year yields need to chillax

Technical Edge
NYSE Breadth: 53% Upside Volume
Advance/Decline: 52% Advance
VIX: ~$15.50
I will keep today’s commentary light and save it for the chart work below.
That said, when I look at the S&P amid this correction, I look at its record as 1 win, 1 tie and 8 losses. It’s got one meaningful rally, one flat day and eight down days. That said, it has suffered a peak-to-trough decline of just 3.15%. In other words, it’s not exactly getting steamrolled.
This looks like a standard, mild correction…so far. That doesn’t mean it can’t get worse, but so far, this looks more like a reset than a rug-pull.
Outside of equities, stock-bulls need 10-year yields to chill. They have been pushing 52-week highs and further strength here will be an issue (more below).
SPY
When we look at the daily chart, the SPY correction looks like a mild pullback to the 50-day and 10-week moving averages, as well as back down to a prior breakout area. I’ve got to be honest here, it looks pretty standard.

If we zoom into a 4-hour chart, you can see how the $451.50 level has become resistance, while the 10-ema has been downtrend resistance. Can the SPY break over the latter early this week to put the former back in play?
If not, and the SPY breaks $442 on the downside, the $437s could be in play.

Upside Levels: $448, $451 to $451.50, $453, $455.50
Downside Levels: $442 to $443.50, $437.50
SPX
Upside Levels: 4490-4500, 4527.50, 4540-45, 4567
Downside Levels: 4435-44 (wide range), 4400, 4385-88
S&P 500 — ES Futures
4470 is more or less holding as support, while 4493-4503 has remained resistance. If we can push over the latter, the 4540s opens up as a possible upside target.

Upside Levels: 4493-4500, 4512-15, 4540-42, 4550-60
Downside levels: ~4465, 4450-55, 4425
NQ

Upside Levels: 15,300, 15,450-525
Downside levels: 15,000-30, 14,750-850 (admittedly a wide range)
QQQ
Nice doji candle on Friday. If we get a daily-up rotation over $368, it puts the 50-day back in play, then a potential push up to the $371 to $372 zone.
On the downside, bulls want to see yesterday’s low of $364.69 hold. If it breaks, $363 to $364 is key.
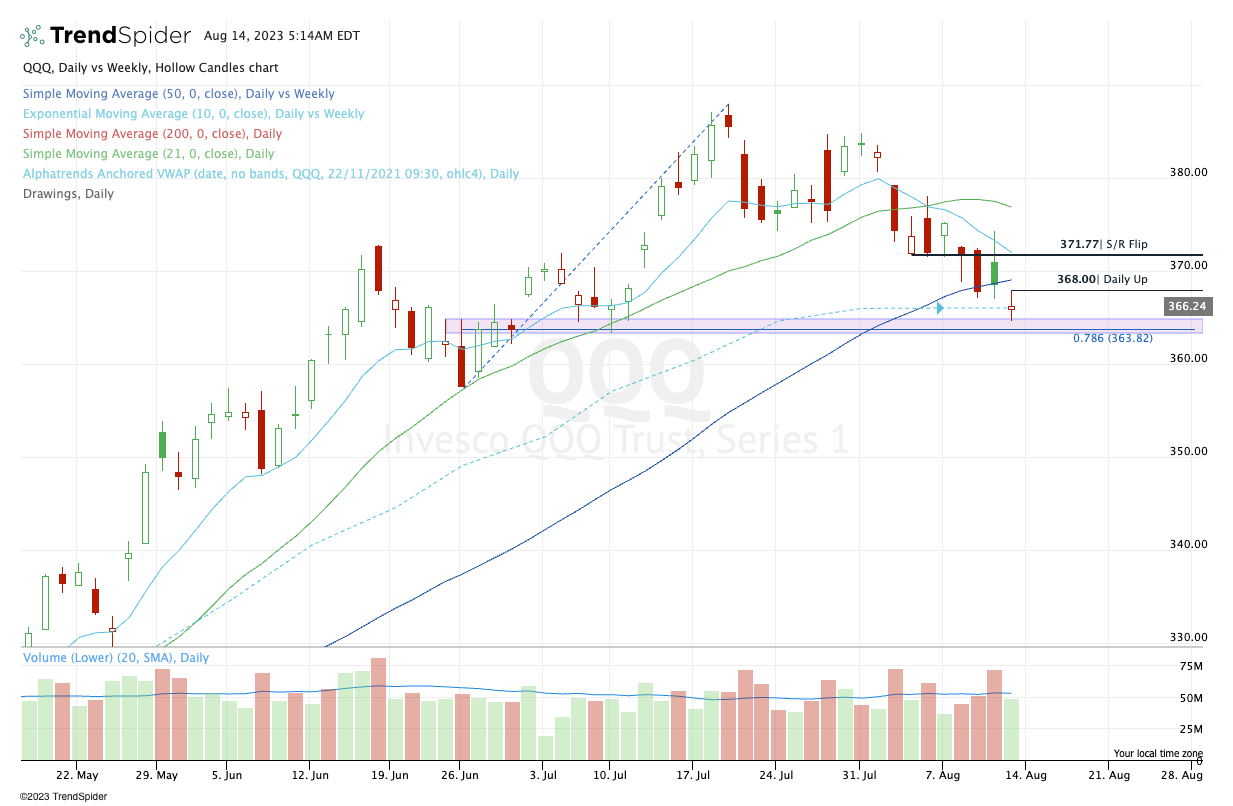
Upside Levels: $368, $371-$372, $374.50
Downside levels: $364.69 (Friday’s low), $363-64
DXY

Need the dollar to stop firming up to take some pressure off equities.
The good news? The DXY is into resistance. The bad news? A breakout could put $104+ in play.
The other issue is 10-year yields…
TNX
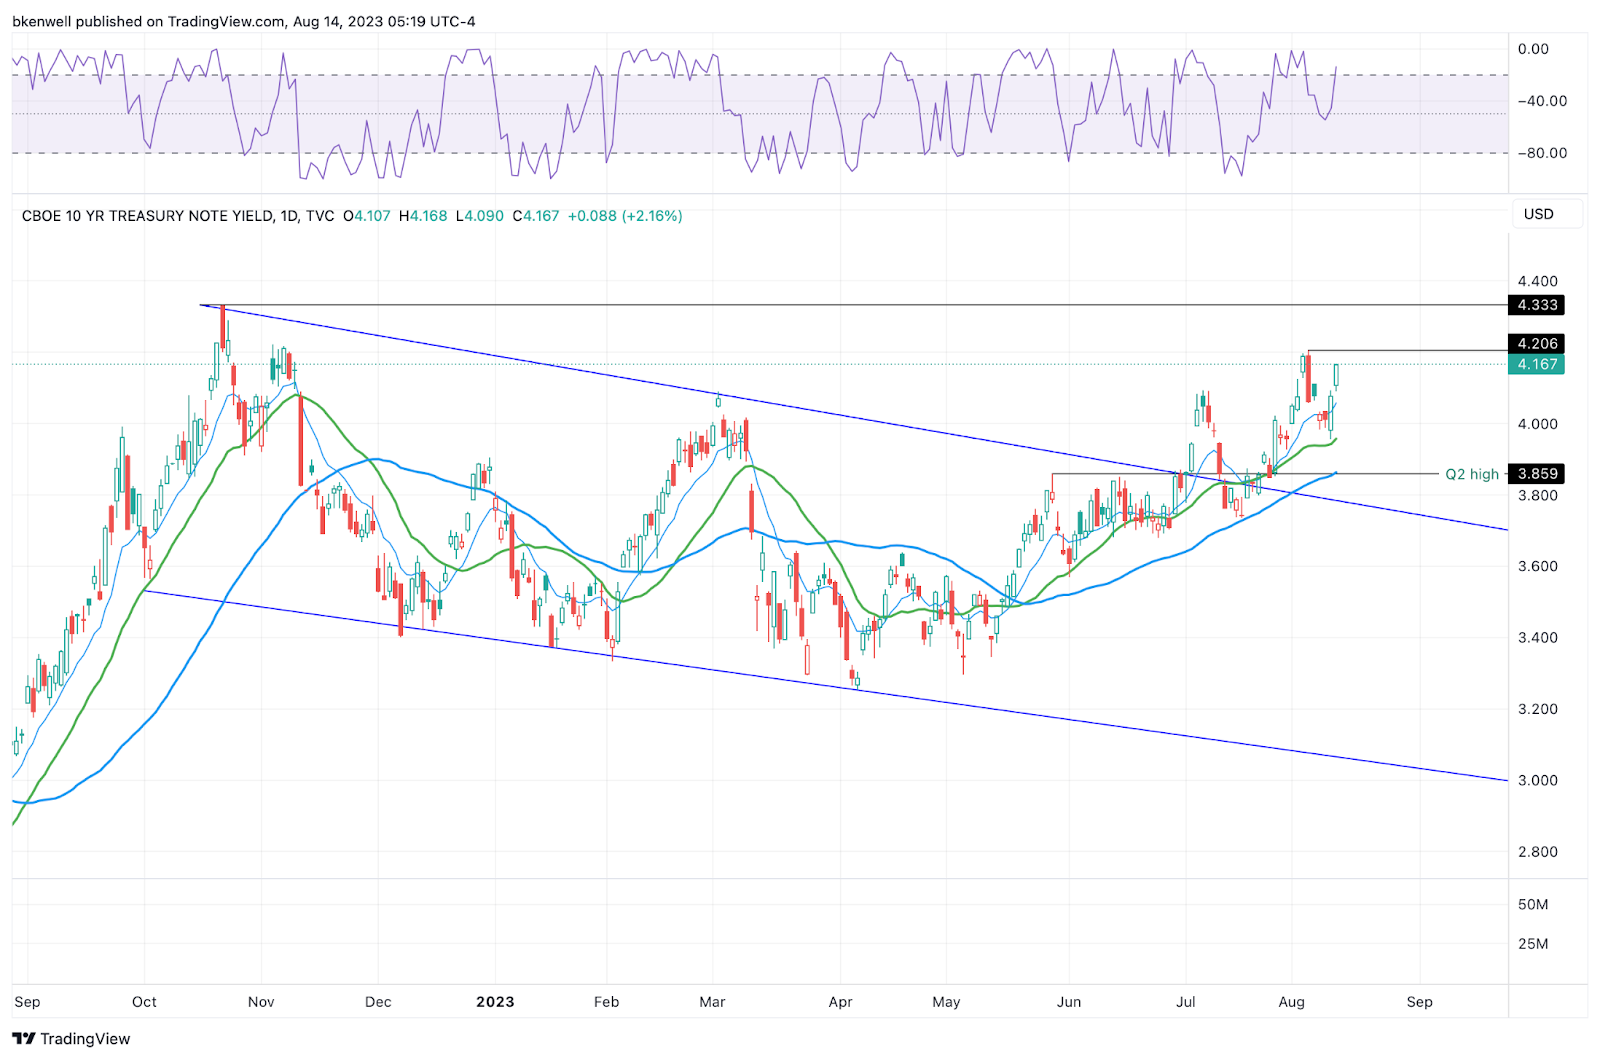
The TNX has been robust lately, which is up over 5% in the last two days. The TNX (10-year yields) are firmly in a breakout, the question now is…how far will they run?
If TNX clears 4.20-21, it opens the door back up to the one-year high of 4.333. Note that the TNX topped out in late October, about a week after the S&P hit its 52-week low.
Economic Calendar

Disclaimer: Charts and analysis are for discussion and education purposes only. I am not a financial advisor, do not give financial advice and am not recommending the buying or selling of any security.
Remember: Not all setups will trigger. Not all setups will be profitable. Not all setups should be taken. These are simply the setups that I have put together for years on my own and what I watch as part of my own “game plan” coming into each day. Good luck!
Open Positions
Keep reading with a 7-day free trial
Subscribe to Future Blue Chips to keep reading this post and get 7 days of free access to the full post archives.