Tables Have Turned as We Await a Pullback
Despite a bear market, we've seen a huge rally and that has us waiting.
Technical Edge —
NYSE Breadth: 47% Upside Volume
NASDAQ Breadth: 65% Upside Volume
VIX: ~$20
Game Plan: S&P, Nasdaq, Bonds, MSFT, CF
A cautious bull state has us continually looking for upside, but man, I’ll tell ya: It would be much nicer to do so from a position of a mild dip and reset in the indices. These “runaway rallies” are not easy to maneuver on painfully low volume in the midst of what could still be a bear-market rally.
I would be trimming into this morning’s opening push on UUP.
S&P 500 — ES
Monday’s action didn’t change much.
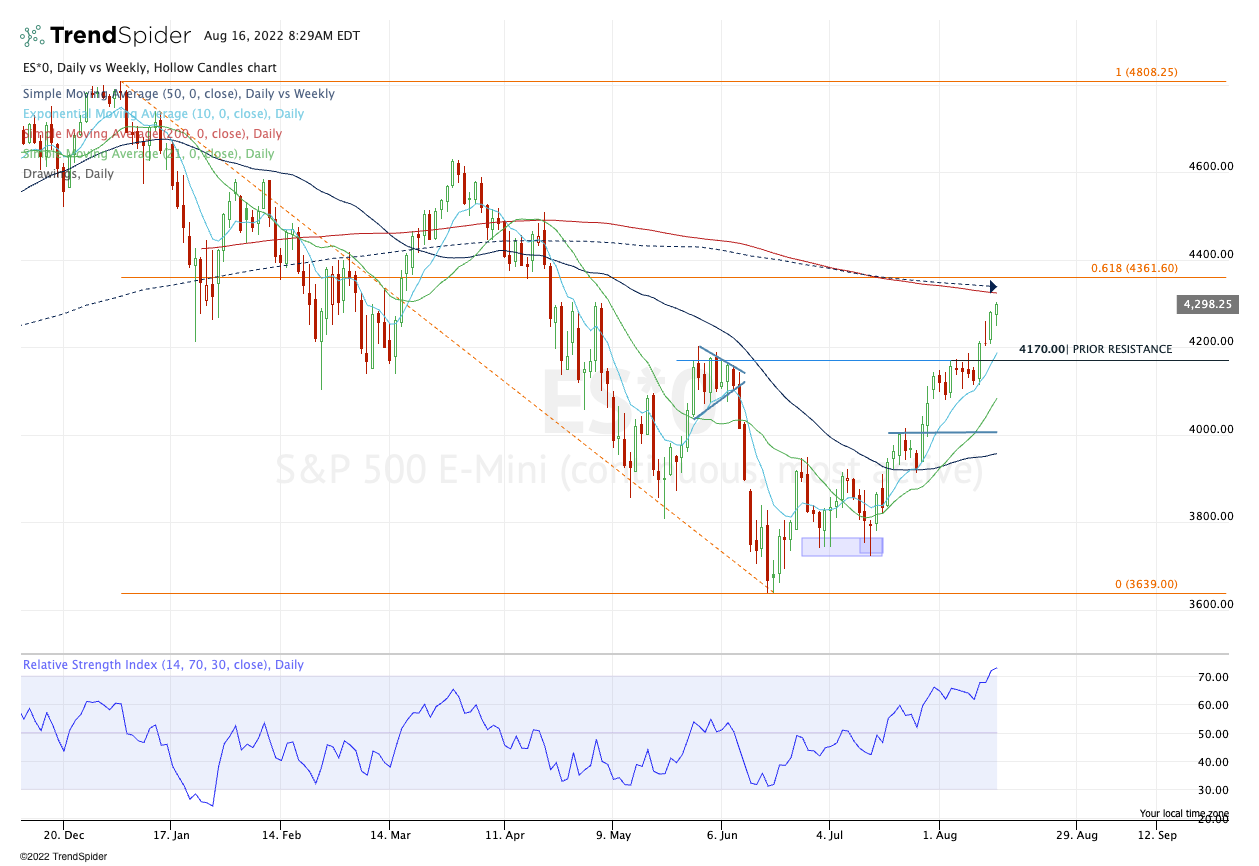
I would still love a pullback to the 4170 area and the rising 10-day ema.
If we continue to push higher, the 61.8% retrace near 4360 is on the table, which comes into play just above the 200-day and 50-week moving averages. This area should be a trouble spot in the short-term for the bulls.
S&P 500 — SPX
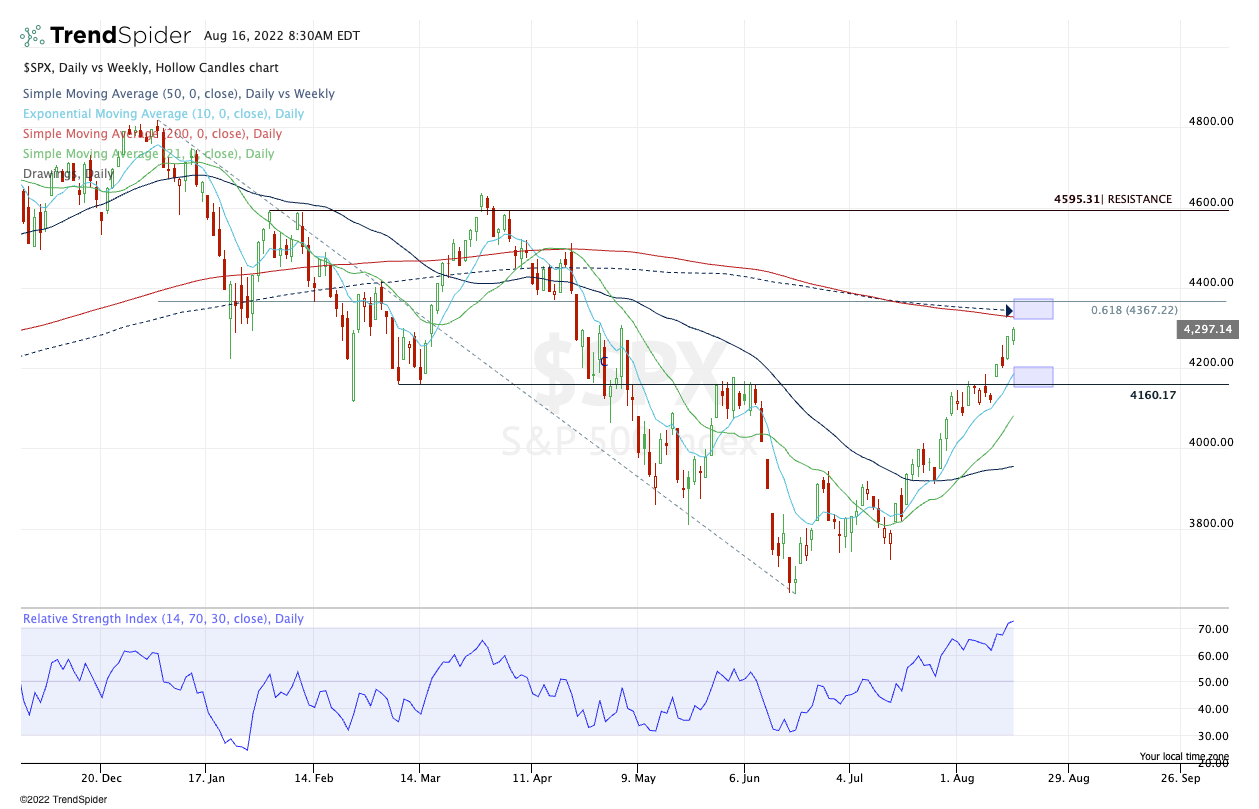
As for the SPX index, 4327 to 4367 is the zone to watch. That’s the 200-day, 50-week and 61.8% retrace of the total range.
On the downside, 4160 to 4170 is on watch, alongside active support via the 10-day ema. It’s been 14 sessions since we tested the 10-day — a stretch that suggests we’re long in the tooth, even if the SPX was down in 6 of those 14 sessions (wall of worry).
Nasdaq — QQQ
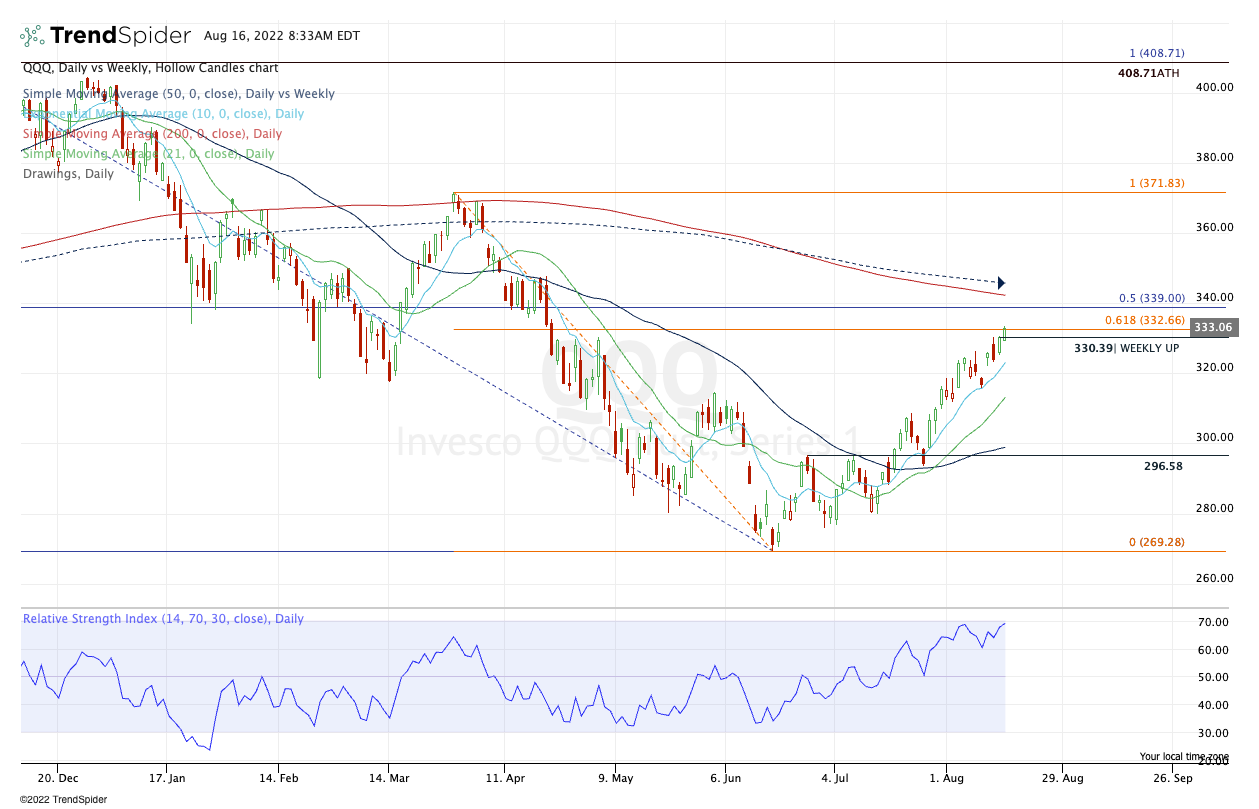
If the QQQ can stay above last week’s high of $330.39 and the 61.8% retrace from the June low to the March high, then $339 could be on the table.
Below $330 and we need to look for a potential test of the 10-day ema.
TLT
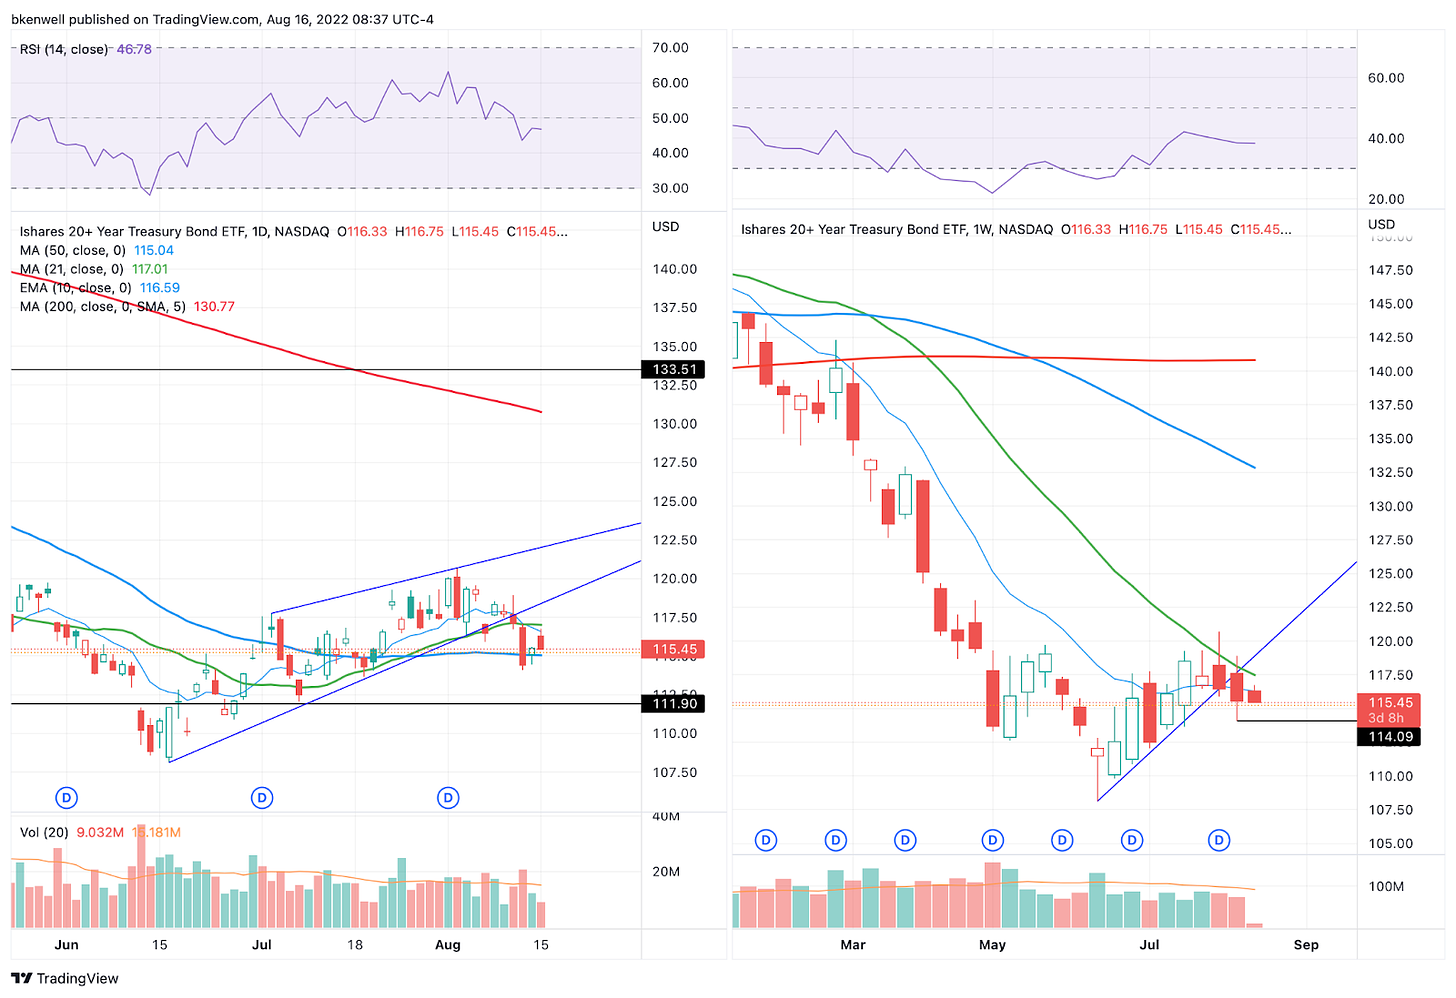
I hate to keep yammering on about the bonds, but yesterday the TLT was sporting a 1% gain and it rolled over and closed red!
The trend here has not been good. $114.09 is the level to watch on the downside (last week’s low). If it breaks, it’s not a good look.
CF
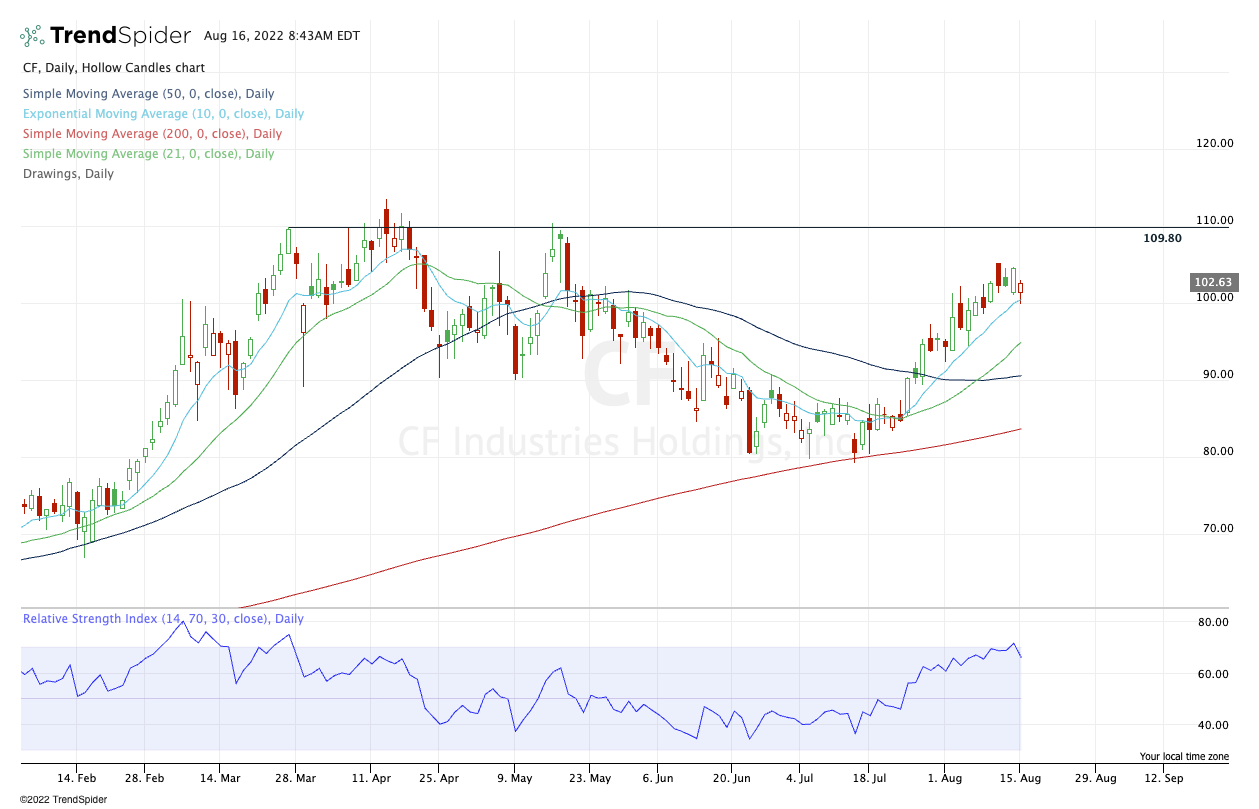
Daily-up over $103 puts last week’s high in play near $105.25, then a potential move up toward $110.
This is a nice rest trade at active support.
MSFT
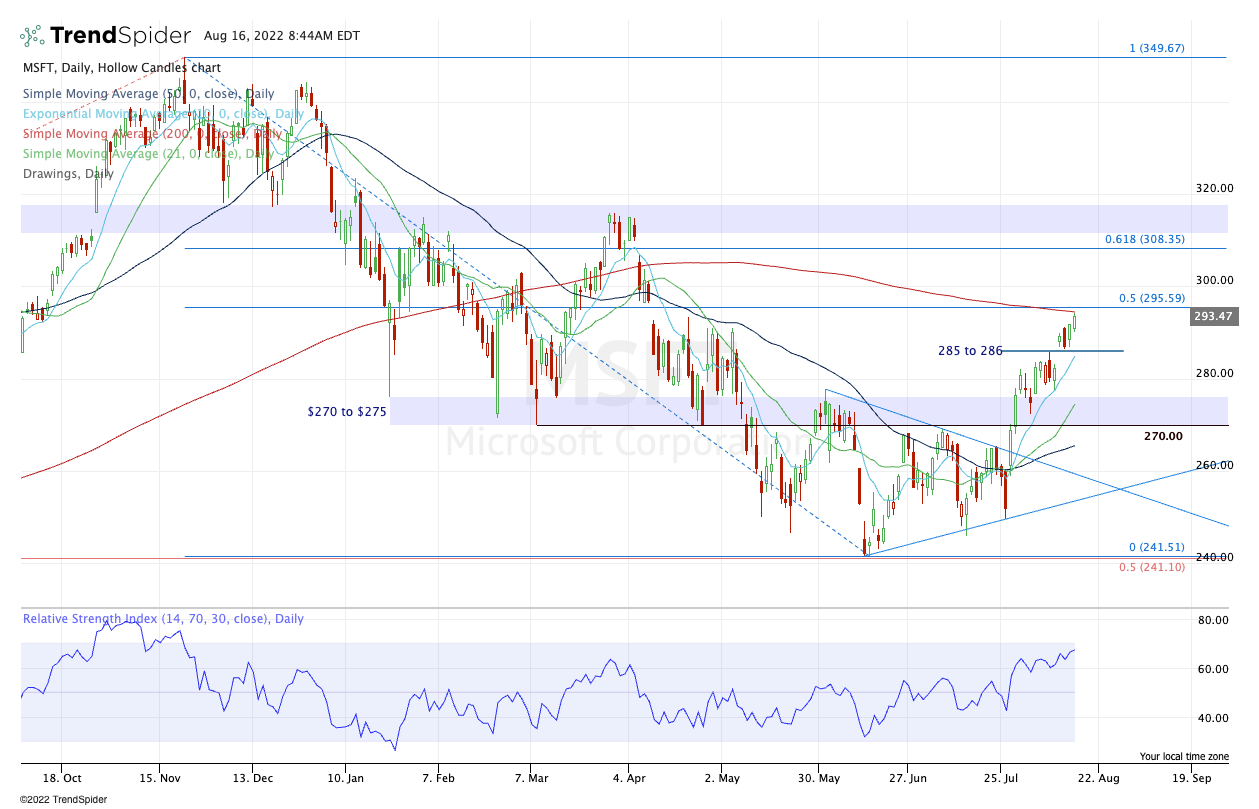
A little caution here (market-wide) as MSFT runs into the 50% retrace and the 200-day moving average. If it backs off, I want to see support near $285 to $286 and the 10-day.
A close above these measures could put $308+ in play.
Go-To Watchlist — Individual Stocks
*Feel free to build your own trades off these relative strength leaders*
Numbered are the ones I’m watching most closely.
Bold are the trades with recent updates.
Italics show means the trade is closed.
Trade Sheets: Now have 2-3 live trades, all with breakeven or better stop-losses. Great stress-free position to be in as we try to squeeze a bit more of upside out of this move.
PEP — Have trimmed PEP twice and now there’s a nice breakout underway. Bulls who want to get rid of it can let the last piece go in the $180 to $181 area. I’m more prone to see if we can get a run toward $185 instead unless the overall market unravels). B/E stop
UUP — $28.60 to $28.80 is ideal trim zone, but bulls can trim ¼ at $28.50-ish if they’d like, as the UUP runs into the 10-day ema.
$27.95 stop-loss.
CHNG — Trimmed a little over ⅓ of position into our first target of ~$24.50. Inching stop-loss up to $23.50. Conservative bulls go with a break-even stop.
Next target: $25 to $25.30
O — Hit our second target at $75-plus. Now B/E stop or $72.75 for more conservative traders.
LNG — I have received a few messages on LNG from the previous update. $155 was the first trim. $160 is a reasonable second trim. $165+ on the rest.
B/e or profitable stop from here.
Relative strength leaders (List is cleaned up and shorter!) →
CNC
HRB
ENPH — kickstarted the rally in Solar
TAN
FSLR
LNG
PWR
CHNG
COST
PEP — trade is live
BA
UNH
XLE
MCK — trade is closed


