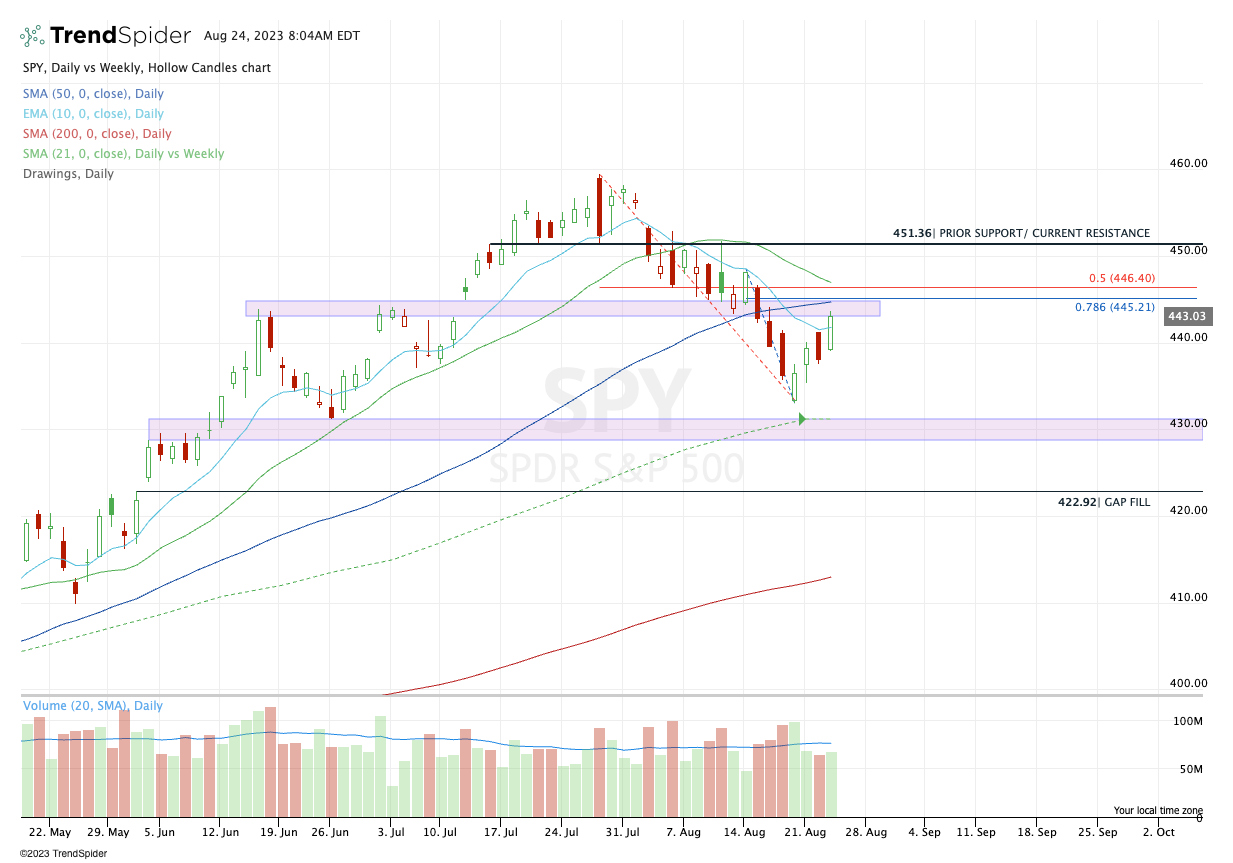
While the August decline was not a horrendous unraveling of the last five months of gains, the mild ~5% dip has a lot of active investors — who are still on edge from the prior bear market — worried it will turn into something larger.
While the decline wasn’t fierce, the S&P lost its 10-day, 21-day and 50-day moving averages, as well as some prior key support areas.
I think we’re in a pretty clear-cut situation in regards to the US stock indices. Either the indices regain these moving averages and prior support levels or they don’t.
If they do regain them, the bulls are back on track and we can use tighter risk parameters — AKA trade against a “line in the sand” — and look for more upside.
If we can’t regain those measures, then we still risk revisiting last week’s low and potentially even lower levels of interest.
As for today’s market, keep a close eye on NVDA. The company blew out earnings and revenue expectations, while guidance came in well ahead of consensus estimates. However, its post- and pre-market gains have been trickling lower. While the stock is still set to open near $500 (and at an all-time high), a sell-the-news reaction on good news — scratch that, on great news — would be a caution flag. That said, the pre-market fade may give NVDA an opportunity to push higher after the opening bell.
Either way, the point is simple: Keep an eye on NVDA today. It will be a dominant theme in today’s action and impact the indices.
Technical Edge
NYSE Breadth: 62% Upside Volume
Advance/Decline: 77% Advance
VIX: ~$15.75
SPY
Wednesday had a nice response to Tuesday’s poor price action. If the SPY can regain $445-46 and hold above that area, it’s a green light for the bulls in my mind. If they can’t, I’m on the lookout for potential weakness.
Upside Levels: $445-46, $450-$451.50
Downside Levels: $443-43.50, $439-40
SPX
Upside Levels: 4460, 4472-75, 4500
Downside Levels: 4440-43, 4425, 4400
S&P 500 — ES Futures
Of the three — SPY, SPX and ES — the futures seem the most clear. Looking at the daily below, the ES is sporting a decent gain, but it’s fading hard from the 4490 area and already lost Wednesday’s 4476.25 high.
On the upside, regaining 4500 is key. Otherwise, bulls have to be on guard.
Upside Levels: 4485, 4493-4503, 4525
Downside levels: 4440-47, 4417-20
NQ
We got 15,175 on the upside and much more, with the NQ rallying to but stalling at the 50-day moving average. The futures look less decisive than their ETF/Index counterparts.
Stalling near 15,340 — which has been a key level — and it will be important to see which way this one tilts.
Upside Levels: 15,420, 15,500
Downside levels: 15,300, 15,190, 15,100
QQQ
The ~$372 area is key for the QQQ to regain and close above and the reason why is pretty clear below:
Upside Levels: $372-72.50, $375
Downside levels: $370, $368, $365
Open Positions
Bold are the trades with recent updates.
Italics show means the trade is closed.
Any positions that get down to ¼ or less (AKA runners) are removed from the list below and left up to you to manage. My only suggestion would be B/E or better stops.)
** = previous trade setup we are stalking.
XXXXXXXXXXXXXXXXXXXXXXXXXXXXXXXXXXXXXXXXXXXXXXXXXXXXXXXXXX
Down to Runners in GE, CAH, LLY, ABBV, AAPL, MCD & BRK.B. Now Add META, AVGO, UBER, CRM, AMZN, CVS, AMD, TLT and YM.
JPM — Many are long from $143-145. This is a longer term swing. Trimmed $153s, then $157.50+ on 7/24.
Down to ½ position vs. Break-even stop. Can make small, ~10% position trim if we see $160+
If worried about a larger correction, can sell/trim north of $150 and look to re-establish lower (if we get it).
XOM — Long from the monthly-up area at $108.50 — First ¼ or ⅓ trim is ~$112.50. Stops at $104.
CRM — long from ~$200 — Trimmed at $207, $209+ and $210. Down to ⅓ or runners here. $213-$215 is the next trim zone.
QQQ — Down to ¼ or less (aka runners). Congrats
These went from the $2.50 to $300 range up to $8.00 on Tuesday’s open. Remainders should be $12.00+ on Thursday. Exit the runners, IMO.
Go-To Watchlist
*Feel free to build your own trades off these relative strength leaders*
Relative strength leaders →
LLY
Energy stocks — VLO, SLB, EOG
AI stocks — NVDA, ADBE
Mega cap tech — GOOGL, AMZN
Select retail — ELF, LULU, COST
BRK.B (recent new all-time highs)
CAT
RCL
Relative weakness leaders →
DIS
PYPL
NKE (FL, DKS and China are killing this name).
EL, FL, DG


