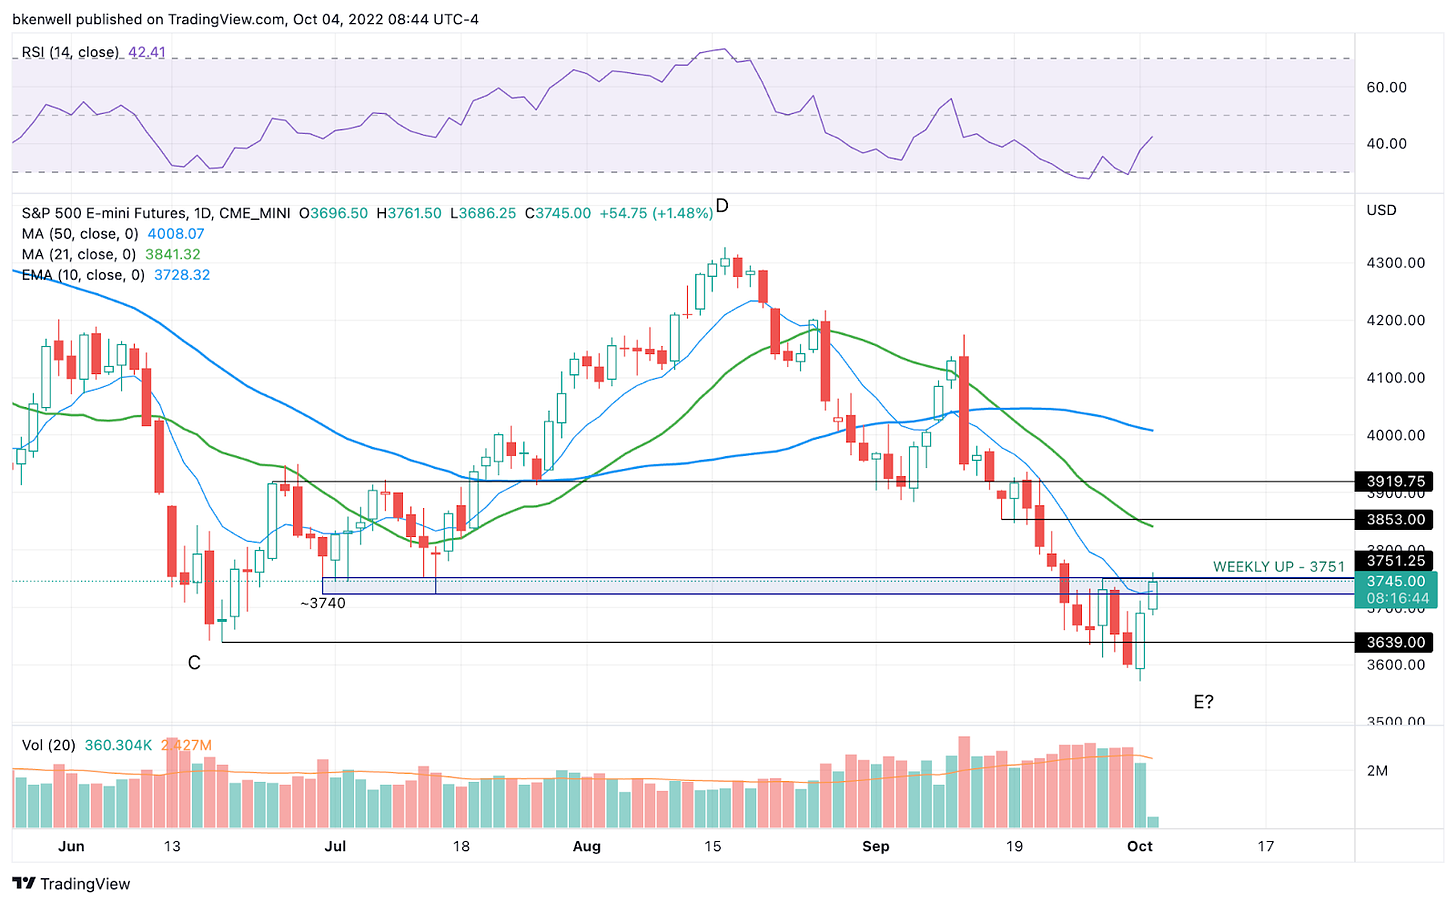
Traders Hoping for a Bottom. Do We Have One?
Today will go a long way toward helping us answer that question
Technical Edge —
NYSE Breadth:89% Upside Volume (!)
NASDAQ Breadth: 80% Upside Volume (!)
VIX: ~$29.25
Game Plan: S&P, Nasdaq
For those of you that took the time to watch our video on Sept. 15, it should be no surprise to see the major indices trading down into the 200-week moving averages. But it brings up this question: Would it be so obvious to trade down to this level and bounce?
Just like it was so obvious to rally up to the 200-day moving average in mid-August and reverse down?
To see the market doing such “obvious things” frustrates the masses, I think, because no one seems to expect “the obvious” in a tape like this.
After an 89% upside day yesterday, we were just short of seeing a 90/90 upside day — which would have been enough to call a possible bottom and get long. Another 80/80 day today could let us make a similar takeaway (although the risk is higher because we would really need another strong rally today before getting long).
S&P 500 — ES
Yesterday’s move was impressive and today, traders wake up to more green across the board.
The ES is pushing higher, with last week’s high in play at 3751. This level was already taken out in Globex, but staying above it in the regular session is the bulls’ goal.
Not only does that create a weekly-up rotation (and a bullish engulfing candle on the weekly), but it leaves a lot of space between current levels and the next resistance spot.
If we open above 3751 and trade back below this level, some traders will consider it a cash flow reversal trade to the downside, with a stop just above the regular-session high (assuming it’s a reasonably small amount).
That setup is not for everyone, but seeing a 5%+ rally from Monday’s Globex low and a big gap-up open into a very key area could give us a reason to make an early sale if the setup is right.
Otherwise, if the ES reclaims 3751 and stays above it, it could put another hundred handles in play up to 3850 and the 21-day. Know your timeframe! Are you trading the 15-minute chart or the daily/weekly?
SPY
Keep reading with a 7-day free trial
Subscribe to Future Blue Chips to keep reading this post and get 7 days of free access to the full post archives.


