Two-Day Lows Are Now Set | Trading Key Setups in Retail Stocks
We have a two-day low to work with in important stocks and indices.
Technical Edge —
NYSE Breadth: 60% Downside Volume
NASDAQ Breadth: 58% Downside Volume
Yesterday was pretty impressive stuff and got us to several trim spots on the Go-To Watchlist. The market was rolling over and breadth was hovering near 80% downside volume. This has “break the lows” written all over it. But then the lows held and the market enjoyed a nice rip higher.
We still ended at about 60% downside breadth, but it was a hell of an improvement in the afternoon vs. the morning.
Game Plan
Keep this in mind. A lot of names have a two-day low that must be respected. If these lows break and can’t be reclaimed, then we could be looking at a continuation to the downside. I don’t mean today necessarily, but next week all of these levels will be key for the bulls to hold, IMO.
Here are some:
ES: 4444.50 (back-to-back matching lows)
SPY: $443.47
NQ: 14,137
QQQ: $348.69
SMH: $248.11 (economic barometer)
ARKK: $60.61
TSLA: $1,021.54 (prior market leader on the rally)
AAPL: $169.85 (prior market leader on the rally)
S&P 500 — ES
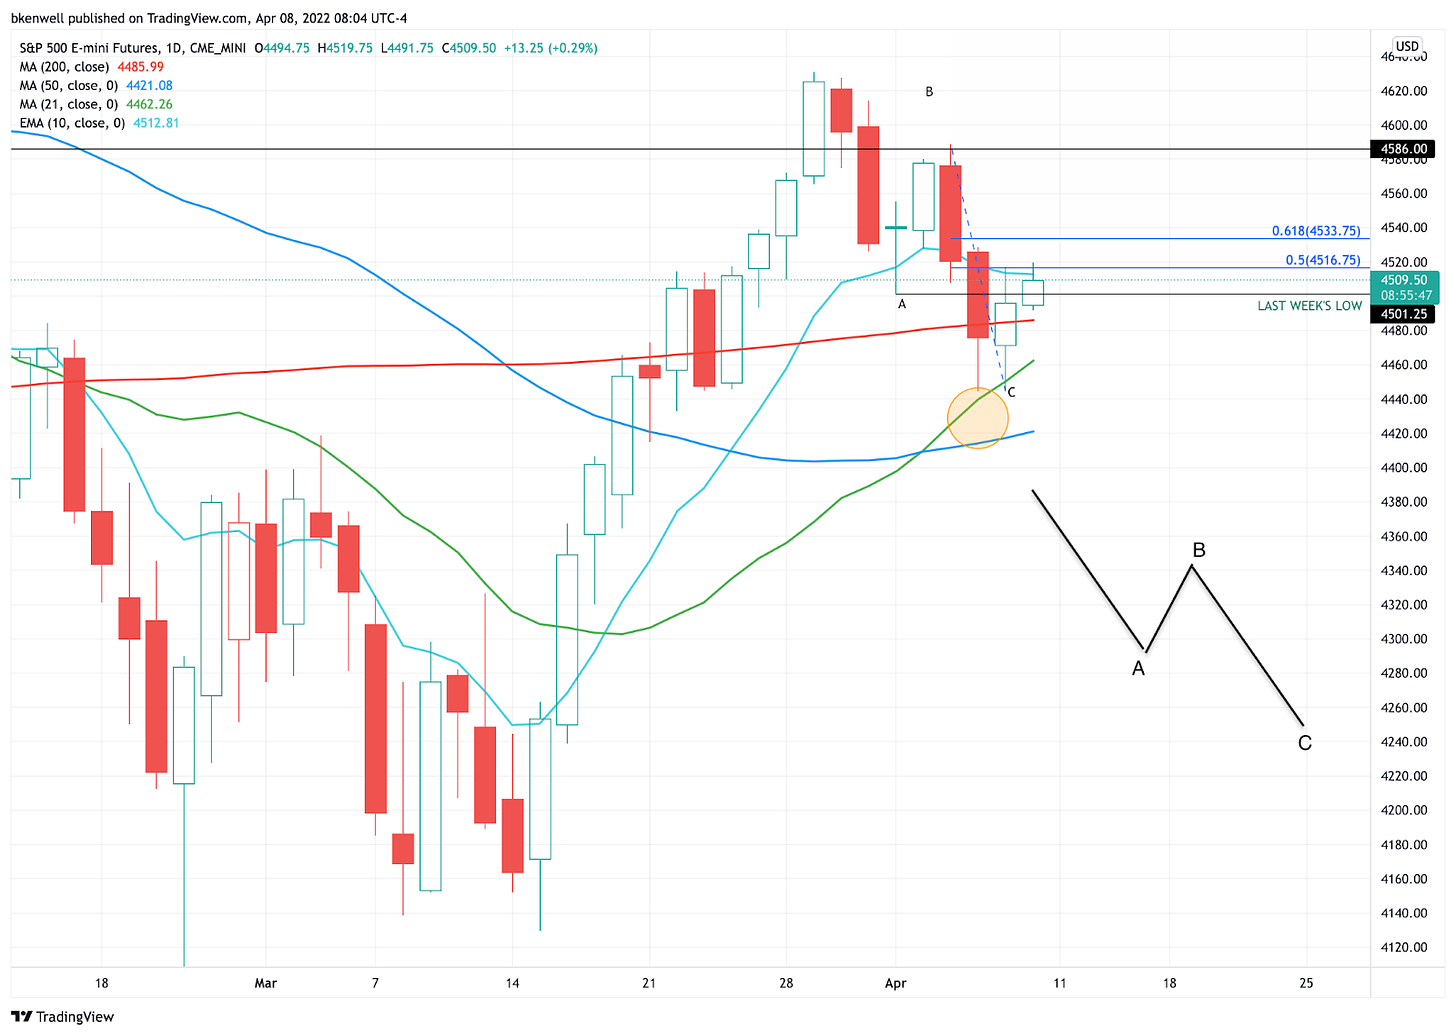
So far we have an “ABC” dip with a two-day low at 4444.50 as the S&P holds the 21-day. However, yesterday’s rebound stalled right at the 10-day and the 50% retracement of this “C leg.”
If the S&P can push above 4517, it puts the 61.8% retracement in play at 4534. Above that and we can look at 4555 to 4560, then 4580-ish. One step at a time though!
If the ES can’t sustain above 4517, then watch the Globex low near 4490. Below that and the 4477 to 4480 area is in play, followed by the 21-day.
**Right now, traders are looking to see if this is a completed “ABC” correction and we’re set to move higher or if it’s an “ABCDE” correction and we have to watch the vulnerability of the lows.**
TLT
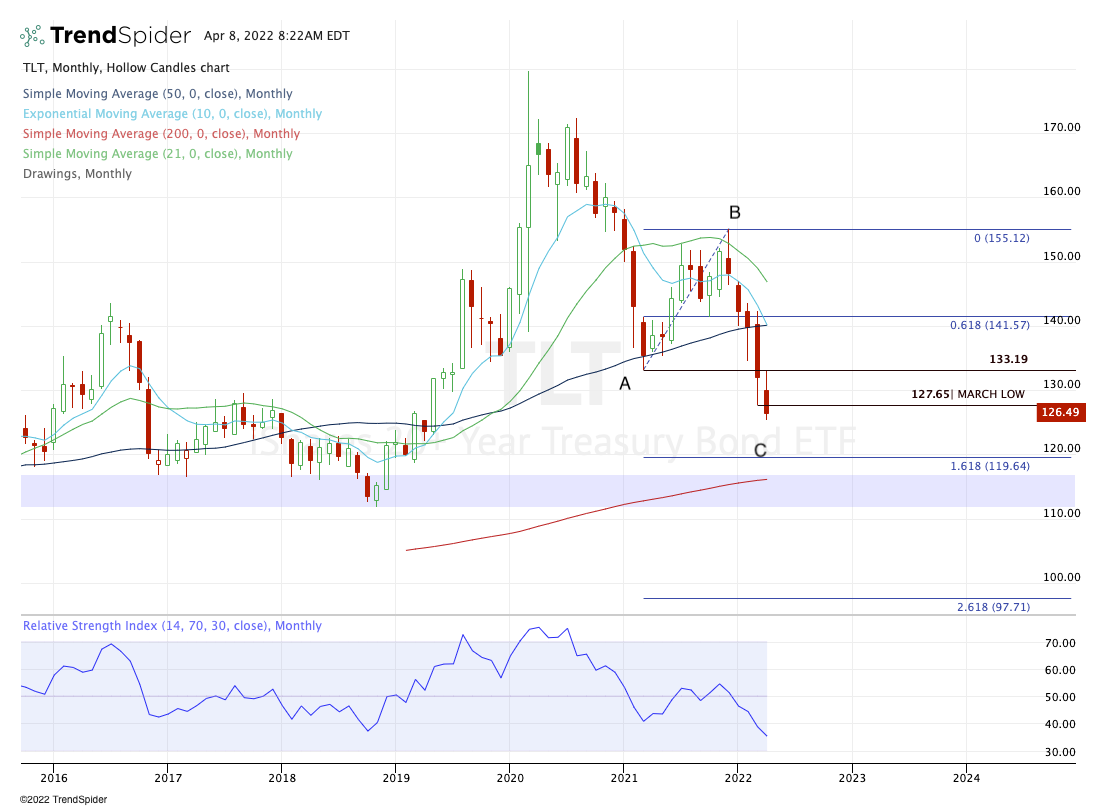
Bonds have been a big driver for stocks, particularly tech. Here’s one idea as it pertains to the TLT, which is under pressure again this a.m.
Could we see an eventual move down to the 200-month moving average?
Retail Stocks — Setups & Charts
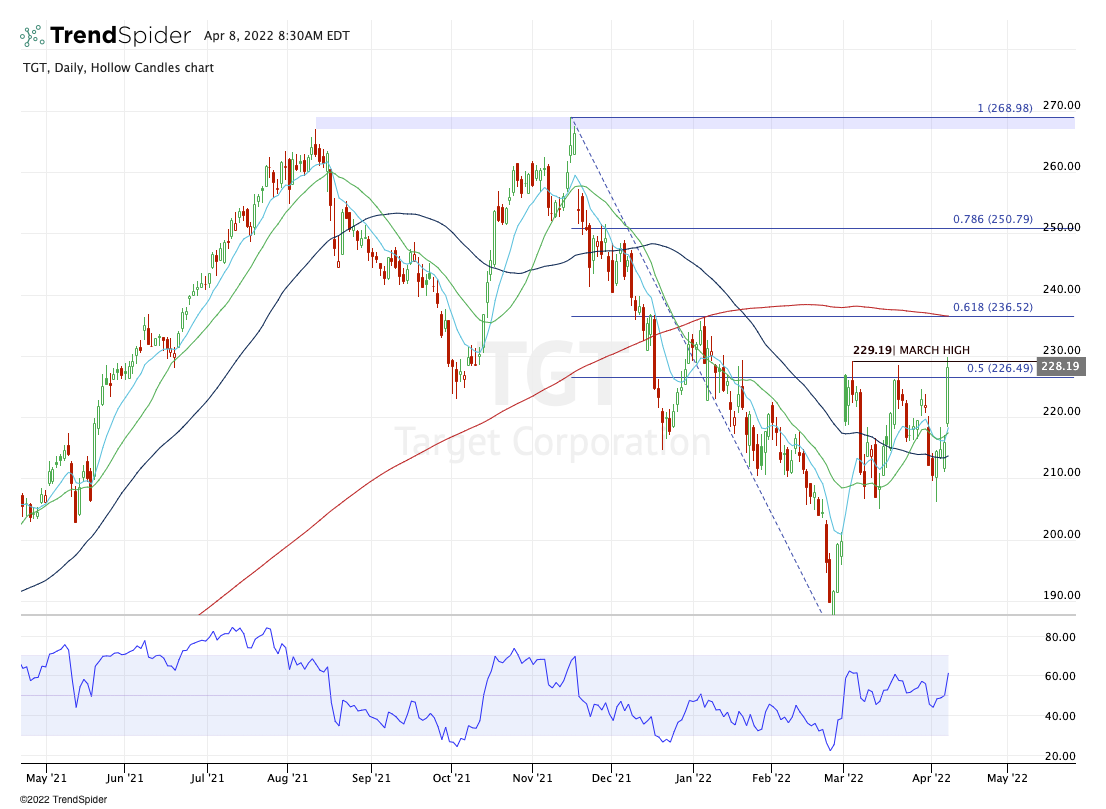
TGT — Monthly-up over $229.25. A daily close above puts $236 in play, then potentially $250 before higher targets come into play.
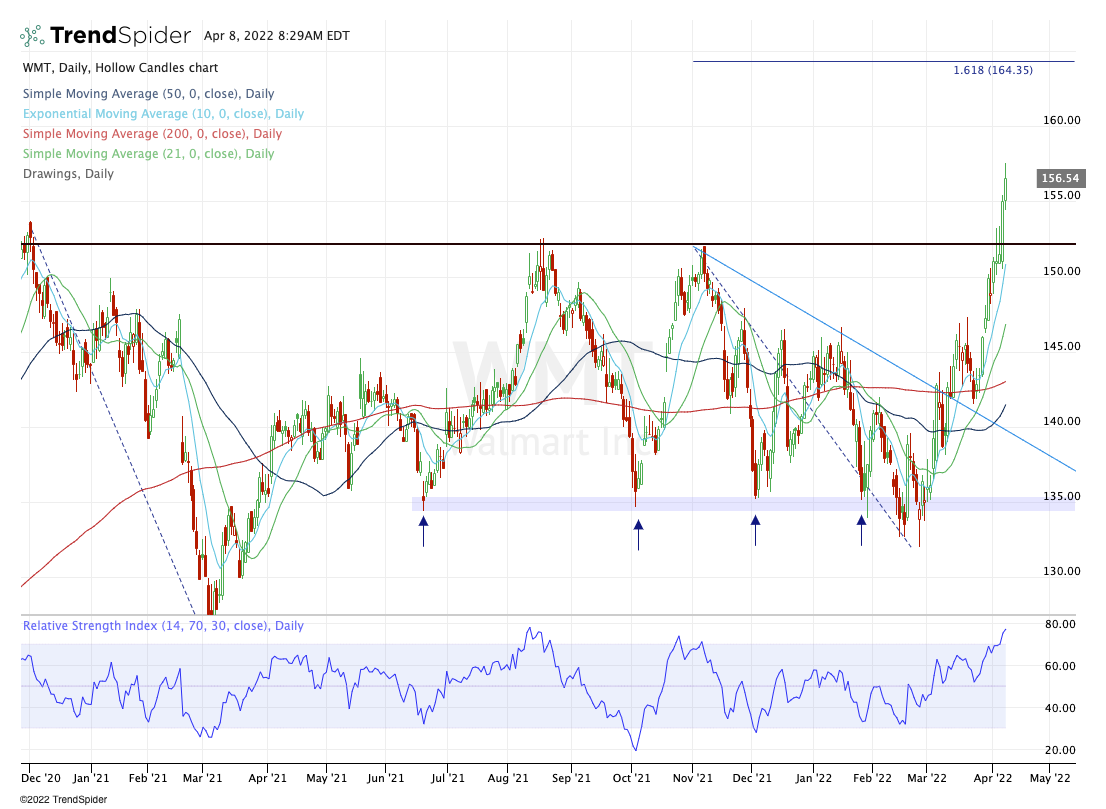
WMT — I want to buy the dip into the $152-ish area, preferably if it lines up with the 10-ema
COST — We have spanked this relative strength leader a few times lately. Let’s wait for a reset.
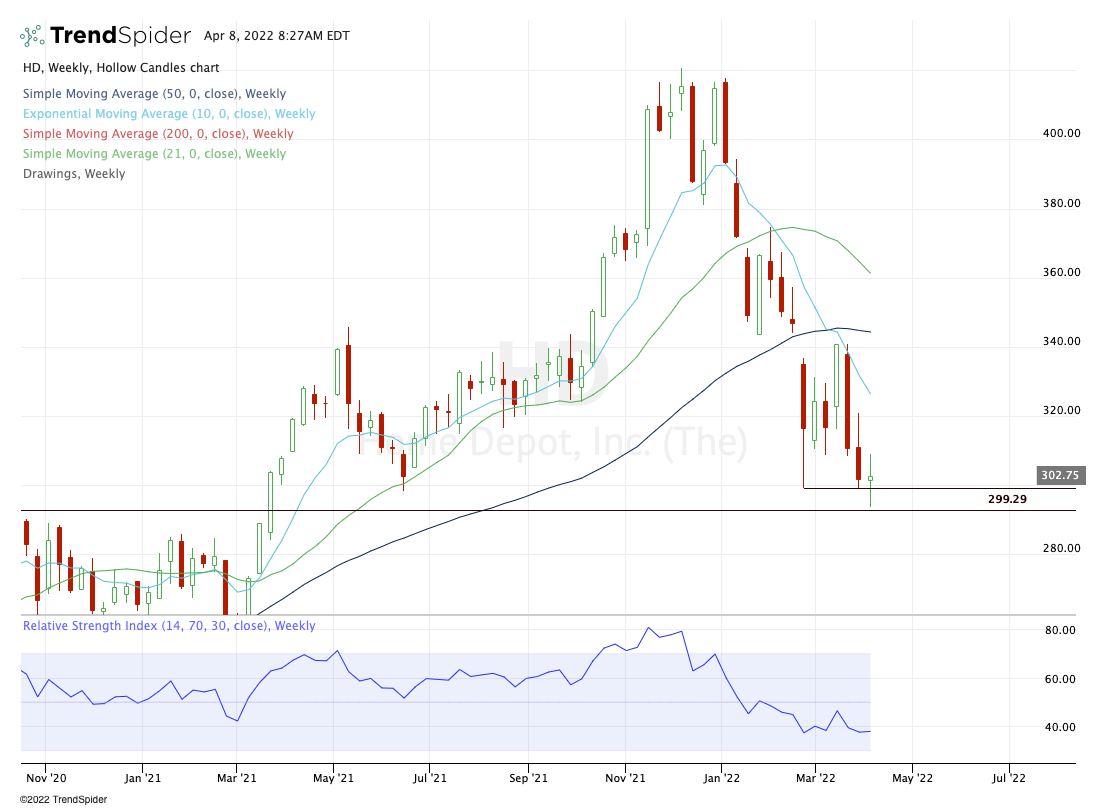
HD — Short-term trend has not been friendly, but seasonality is shifting into HD’s favor (the upcoming quarter is its strongest quarter while the retail sector has been coming to life. Just something to watch. Aggressive bulls can consider long around $300, with an initially wide stop down now $288 to $293, depending on how conservative bulls want to be.
TGT
WMT
Go-To Watchlist
*Feel free to build your own trades off these relative strength leaders*
Numbered are the ones I’m watching most closely. Please look at these closely, as there are several updates (the most recent of which are noted in bold).
Watching XLB to see how it consolidates these gains. Break lower or remain a leader?
PANW — Next trim spot is $645 to $650 — careful. $595 stop.
MCK — Boom! Second trim spot hit. Look for $323 to $325 on final runners.
MKC — $103 to $104 Trim Spot hit → Stop now at break-even or ~$99. Look for another small trim at $105+ | If we see $107 I want to be down to just ⅓ position
DLTR — Triggered — Lowering trim spot to $159.50 to $160. If we see $162, I want to be down to ½ — and trimming the rest at $165.
Look at how strong these stocks have been!! In a market rife with volatility, head-fakes and downtrends, these names are trending higher. That’s why I always say “feel free to build your own trades off these relative strength leaders!” They are dominant.
I have been wanting to do a video on these names, but I’ve been sick all week. If I can’t do a video in the near-term, perhaps I will do a separate newsletter post!
COST
ABBV
TU
VRTX
BMY
Energy — FLNG, XLE, APA, CNQ, CVX, ENB, PXD — etc.
ADM, MOS
PANW
AR
AMGN
ABC
UNH


