We did our last video on Sept. 15, where we were cautious, bearish and warned of a test of the 200-week moving average, which we got on Friday at quarter-end.
As referenced in the video, here is the long-term performance of the S&P 500 and why we are, generally speaking, long-term bulls at heart.
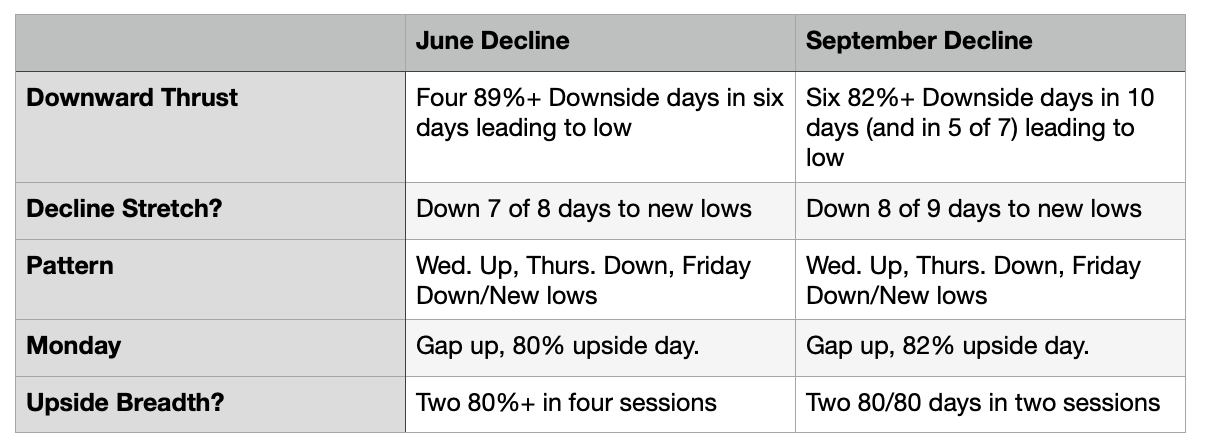
Lastly, here’s a table of some of the things we discussed as it relates to breadth.
For those that don’t want to watch the video, that’s okay too. This is what I am looking at the SPY now:
SPY
June and September had some real similarities with the way the SPY hit new lows.
In June: We had a nice up-day on Wednesday June 15th, with 80% upside volume, a big thrust lower on Thursday with 94% downside volume, then mixed breadth on Friday as the S&P made new lows.
That was followed by a gap-up on Monday and two 80%+ upside days in four session.
In September: We had an 89% upside day last Wednesday, then an 85% downside day on Thursday and finally, a mixed breadth day on Friday as the S&P made new lows.
Then a gap-up on Monday and back-to-back 80/80 days (which is 80%+ upside breadth and an 80%+ advance/decline ratio).
September’s price action doesn’t repeat that from June, but it does rhyme.
What to Make of the Action — The Setup
Watch with a 7-day free trial
Subscribe to Future Blue Chips to watch this video and get 7 days of free access to the full post archives.


