Amazon disappointed Wall Street with its third-quarter results. With a rare revenue miss and disappointing guidance, lack of momentum in FAANG and the Nasdaq near its highs, the Street isn’t being shy about selling this one lower.
Hey, maybe a stock split at some point will help out. But that’s not the case yet. Let’s look at the chart.
Trading Amazon Stock

Amazon is trading at about $3,350 in the pre-market, down roughly $250 a share or about 7%. It’s not the end of the world, but it’s a gut-punch for those that were hyped up coming into the quarter.
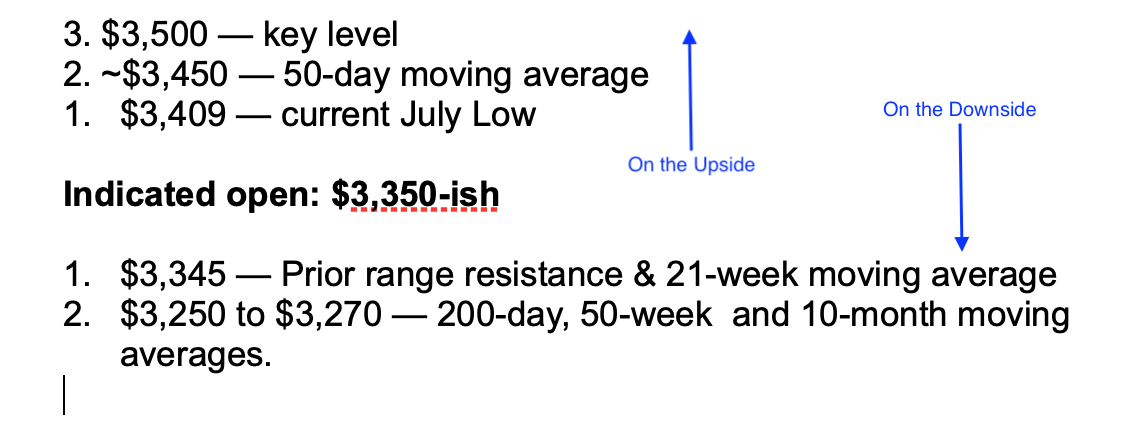
$3,345-ish is an area of interest to me — so about right where we are in pre-market trading. That’s a prior range resistance level and the 21-week moving average. A gap-down open is going to happen. That much is clear. What’s not clear is what Amazon will do once 9:30 rolls around.
Does it bounce immediately and mitigate some of those losses? Or do we see a meager bounce followed by more selling?
If it’s the former, we now have a low to measure against and can target the 50-day moving average on the upside, followed by $3,500.
If it’s the latter and see more selling pressure, the $3,250 to $3,270 area is calling for attention. While the 200-day moving average hasn’t been that significant in 2021, the 50-week moving average has been very significant. Both come into play within this range.
I would look at it like this:
Good luck and remember, you don’t have to trade AMZN. It’s just a framework. If something outside of our parameter occurs, Amazon can simply be a “no touch” today.
Disclaimer: Charts and analysis are for discussion and education purposes only. I am not a financial advisor, do not give financial advice and am not recommending the buying or selling of any security.


