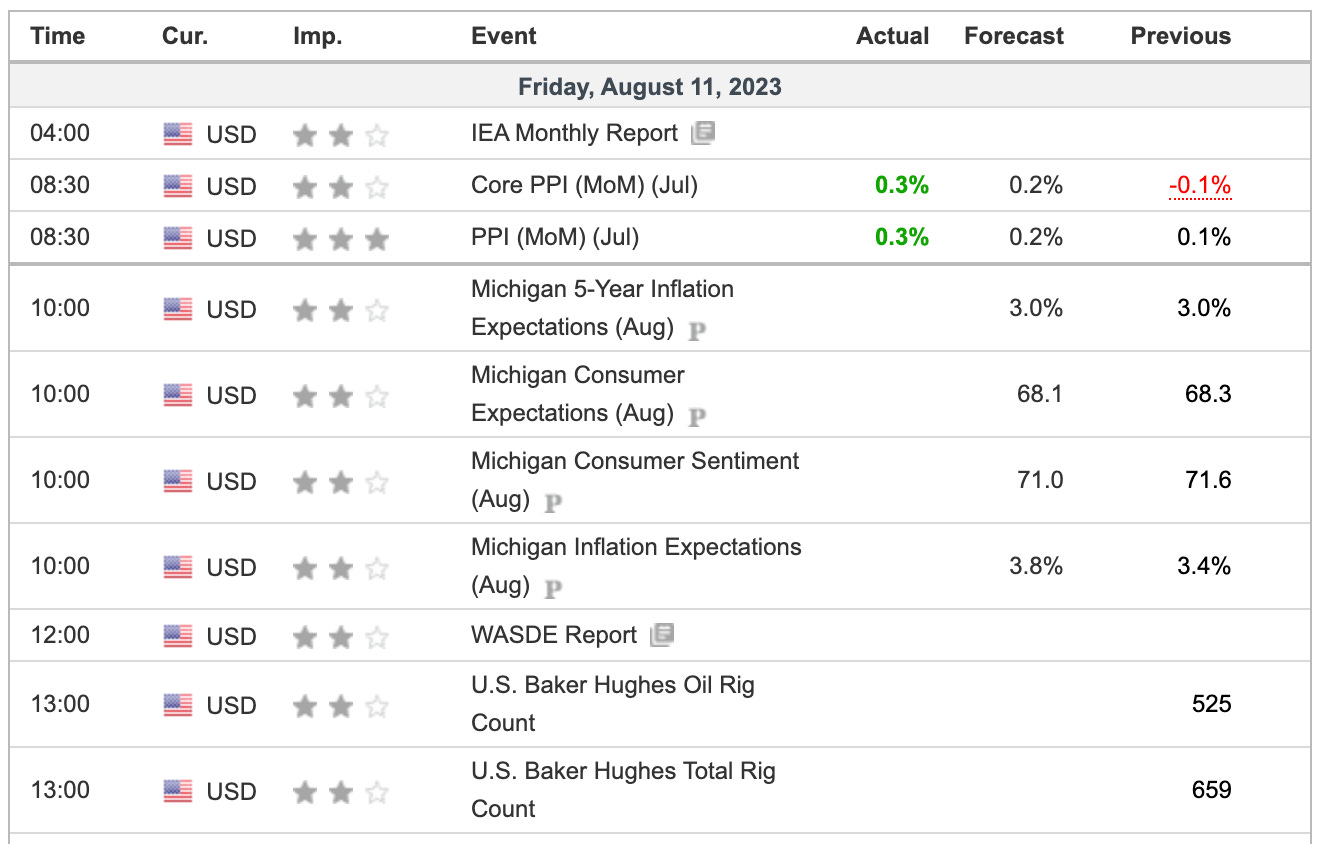
Yesterday’s CPI report should keep the Fed off the rate-hiking bandwagon. We’ll get another look at the PPI number today (update: the numbers came in a touch hot), but overall, various inflation gauges have been trending in the right direction.
The market seems to think so too, as the Fed Funds Futures odds have ticked lower for a September hike, which now stand at just 9.5%. The other ~90% sits on the likelihood that the Fed pauses at the next meeting and doesn’t alter rates.
For what it’s worth, that 9.5% figure is down from 11% a day ago, 13% a week ago and ~22% a month ago.
I don’t know that there’s really a reason for the Fed to lower rates at this point. For the time being, it seems reasonable that they will sit at the current range of 5.25% to 5.50% unless they feel the need to raise further or that it’s time to lower rates.
For those wondering about individual stock setups, I would only note that there are times to size up and swing big and times to size down and narrow our focus. We had a multi-month run of hit after hit. When the market environment changes — like right now — we have to shift our strategies a bit too. I’d rather miss a few winners than eat a bunch of losers and sap away our earnings from the last run.
As for the indices, we’re down 6 of the first 8 sessions of August and essentially flat in one of the “up” days (as the S&P faded 1.3% from yesterday’s high and closed higher by 0.04%).
At some point, the buyers will step in. Selling the rallies is fine, but shorting into the hole is not my cup of tea.
Set to open near yesterday’s low, can buyers get a rally going?
Technical Edge
NYSE Breadth: 54% Upside Volume
Advance/Decline: 44% Advance
VIX: ~$15.75
SPY
How do you like that $451.50 level? That zone held firm as resistance as the SPY rolled over hard from that mark in yesterday’s regular-hours session.
From here, the SPY has a pretty clear-cut job: hold the $445 area and take out the $451.50 mark. Here’s the daily chart to highlight the levels outside of those two marks:
Upside Levels: $451 to $451.50, $453, $455.50
Downside Levels: ~$445, $442 to $443.50
SPX
Upside Levels: 4500, 4527.50, 4540-45, 4567
Downside Levels: 4458-4465, 4430-35, 4400
S&P 500 — ES Futures
4540 is holding firm as resistance, while 4470 is now being put to the test in this morning’s pre-market session. We had 4470 mapped as part of the CPI trade on Thursday, but it’s in play now.
That level is the 50-day moving average and the 61.8% retracement. Bulls would like to see this level hold by the close today.
On the upside, the ES needs to regain 4493 and ideally, 4500+
Upside Levels: 4493-4500, 4516-4520, 4540-42, 4550-60
Downside levels: 4470, 4450-55, 4425
NQ
Ideally bulls want to see the 15,100 area hold as support. Otherwise 15,000 is in play and potentially lower.
Upside Levels: 15,270, 15,340, 15,425-450, 15,525-550
Downside levels: 15,100, 15,000, 14,750-850 (admittedly a wide range)
QQQ
~$367 is the two-day low and the QQQ is holding the 10-week moving average. Those who were long into Friday morning had an excellent opportunity to unload into strength.
Now trading near the two-day low ahead of the open, the QQQ could have an overshoot down to the $364 area. If so, I’d expect a bounce from this area, even if it’s only temporary.
Upside Levels: $371-$372, $374.50
Downside levels: $367, $364
CRM
I’m not sure that we’ll see it, but something closer to the $200 area on CRM would be an attractive entry for bulls. There are plethora of potential support areas in play here and we can use a tight-ish stop around $194 to $195.
Economic Calendar
Disclaimer: Charts and analysis are for discussion and education purposes only. I am not a financial advisor, do not give financial advice and am not recommending the buying or selling of any security.
Remember: Not all setups will trigger. Not all setups will be profitable. Not all setups should be taken. These are simply the setups that I have put together for years on my own and what I watch as part of my own “game plan” coming into each day. Good luck!
Open Positions
Bold are the trades with recent updates.
Italics show means the trade is closed.
Any positions that get down to ¼ or less (AKA runners) are removed from the list below and left up to you to manage. My only suggestion would be B/E or better stops.)
** = previous trade setup we are stalking.
XXXXXXXXXXXXXXXXXXXXXXXXXXXXXXXXXXXXXXXXXXXXXXXXXXXXXXXXXX
Down to Runners in GE, CAH, LLY, ABBV, AAPL, MCD & BRK.B. Now Add META, AVGO, UBER, CRM, AMZN, CVS, AMD, TLT and YM.
Keep reading with a 7-day free trial
Subscribe to Future Blue Chips to keep reading this post and get 7 days of free access to the full post archives.


