The S&P had traded lower in the first four days of August, then rebounded yesterday on Monday as the index was leaning on key support. For active traders, it left the S&P at a tricky juncture.
While we closed fine on Monday, there was a big question mark in place: Is this just a bounce setting us up for lower prices or are the bulls actually going to regain control?
As we have been outlining this month (both fundamentally and technically), the S&P appears to be setting up for lower prices. The Fitch downgrade of US debt was the “excuse” to sell off last week. Now, more worries are hitting equities this morning.
That’s as Moody’s “lowered credit ratings for 10 small and midsize US banks and said it may downgrade major lenders including U.S. Bancorp, Bank of New York Mellon Corp., State Street Corp., and Truist Financial Corp. as part of a sweeping look at mounting pressures on the industry.”
It’s also as “investor sentiment also took a hit after China released more data that showed its economic engine is sputtering. Exports plunged by the most since early 2020, the beginning of the Covid pandemic, and imports contracted last month.”
This action has stocks under pressure and yields falling. In an ordinary world, seeing the 10-year yield drop back below 4% would be a positive for equities. However, that’s not the case when it’s a true flight to safety (i.e. investors are selling “risk-on” assets and piling into “risk-off” assets like Treasuries).
Perhaps luckily, we were bullish on TLT from Friday.
So where does that leave us now?
The S&P futures are trading down into the key 4493 to 4503 support zone and are finding a bid down in that area. At the Globex low, the ES was down more than 42 handles or almost 1%.
We may revisit that low in the regular-hours session, but how it handles this area in the face of bad news will be telling.
Essentially, bulls want to know if support holds around 4500 or if this level breaks, thrusting some of the intermediate-term levels into play that we highlighted yesterday.
Let’s revisit those levels.
Technical Edge
NYSE Breadth: 61% Upside Volume
Advance/Decline: 61% Advance
VIX: ~$17
SPY
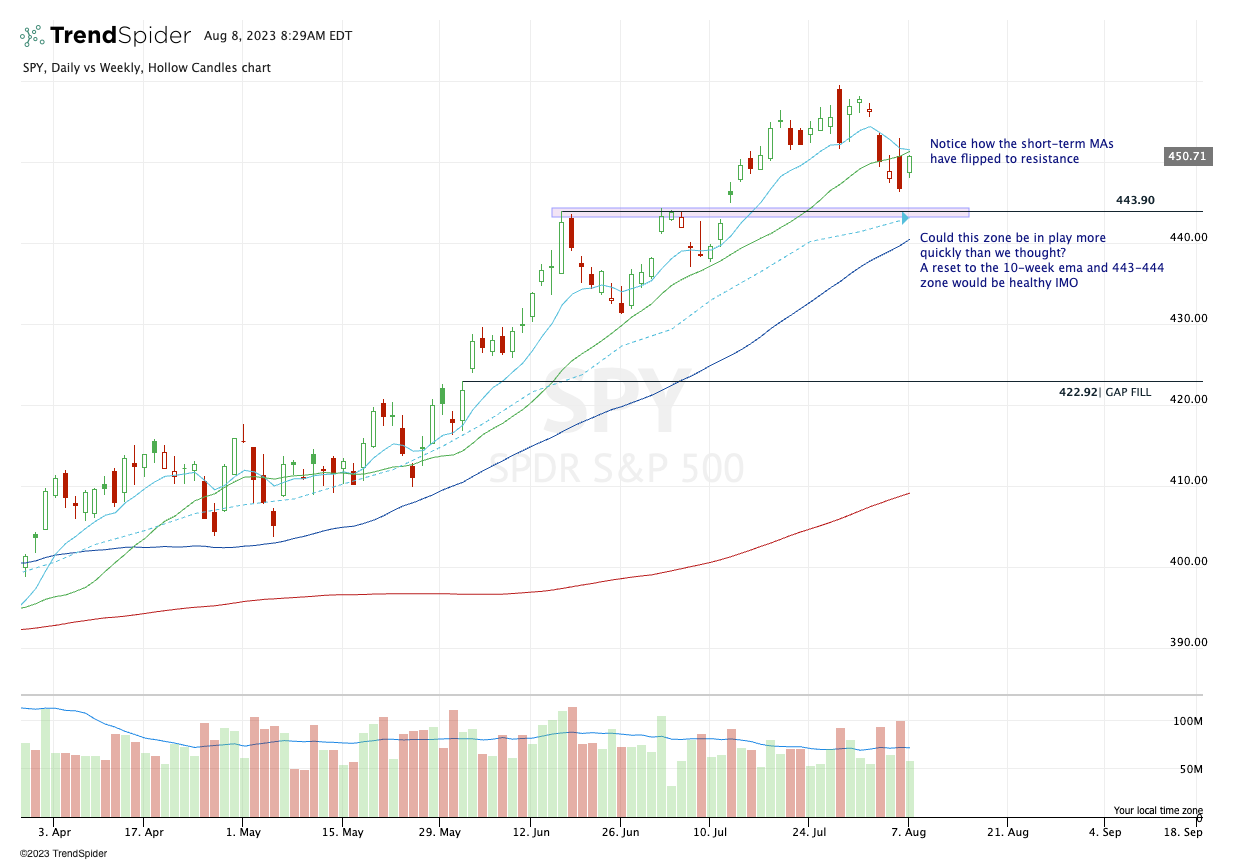
Before we panic and freak out, the SPY is trading lower by about 0.75% in the pre-market, but is trading down to fill the intra-day gap from Friday. As long as last week’s low of ~$446.25 holds, then bulls could make a case for being long. If it doesn’t hold, the daily chart highlights our levels of interest.
Upside Levels: $448, $450, $451.50
Downside Levels: $447.25, $446.25, $444 to $445
Daily chart with note:
SPX
Upside Levels: 4495-4500, 4526-30, 4540
Downside Levels: 4475-78, 4555-60, 4540, 4532
S&P 500 — ES Futures
On the daily chart, you can see where the 4460 area brings up a couple of key measures in the 50-day moving average and the 78.6% retracement.
Key support: 4493-4503
Upside Levels: 4220-22, 4530, 4546-50
Downside levels: 4493-4503, 4485, 4476, 4450-60
NQ
Somehow, 15,340 continues to hold as support, although a break of this area opens the door down to the 15,275 area. Ideally, bulls will want to see the NQ regain the 200-sma (on the 4-hour chart, below).
Upside Levels: 15,500, 15,525-545, 15,610-625
Downside levels: 15,320-340, 15,275-300, ~15,100
QQQ
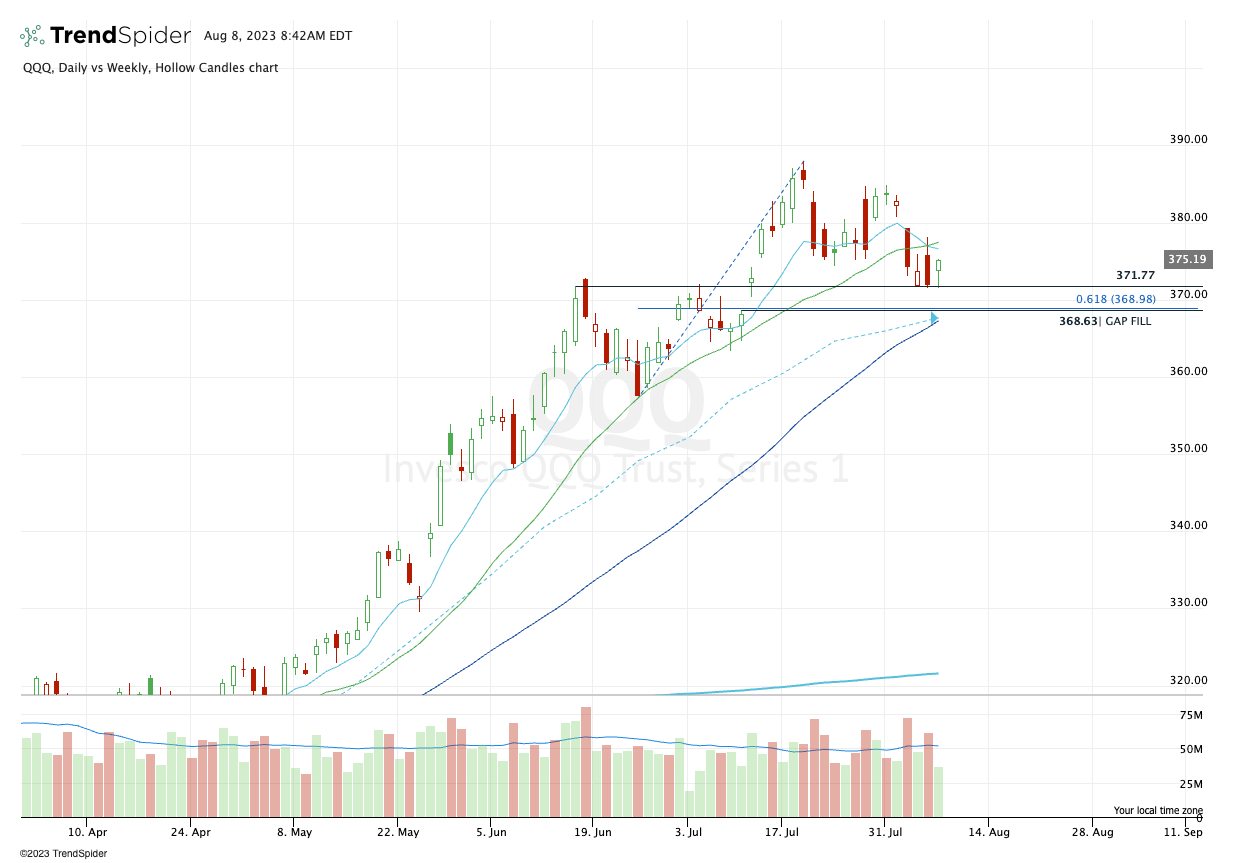
The $371.75 area continues to hold quite well, although that may be put to the test today. If it breaks — significantly — it could put the $368.50 to $369 area in play (the gap-fill and 61.8% retracement). Just below that is the 10-week and 50-day moving averages.
On the upside, the $376-77 area has been resistance.
Open Positions
Keep reading with a 7-day free trial
Subscribe to Future Blue Chips to keep reading this post and get 7 days of free access to the full post archives.


