Technical Edge —
NYSE Breadth: 59% Upside Volume
NASDAQ Breadth: 63% Upside Volume (!)
VIX: ~$23
Game Plan: S&P 500, SPY, Nasdaq, GOOGL, MSFT
We fished out a really nice trade on the ES yesterday morning, while the bulls are firmly in control of the short-term momentum.
Snap’s 30% plunge this morning is a reminder that we’re still in a bear market and investors must be cautious when taking positions. Stocks are “guilty until proven innocent,” as one trader said yesterday.
S&P 500 — ES
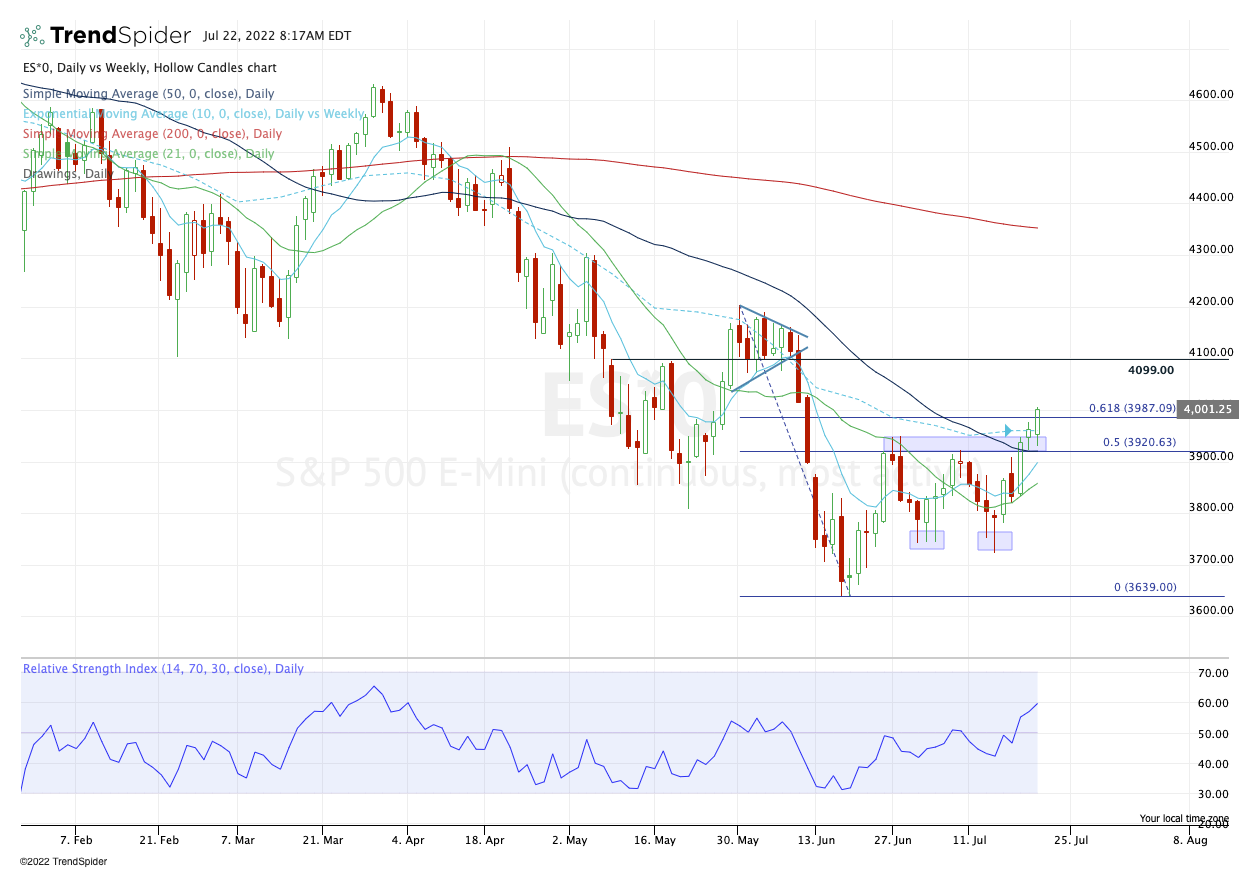
Yesterday we were looking for a test of the 3987 level, followed by 4000. We’re there now. Up 10% from the June low, the S&P is now stretching beyond the usual bear market rally, both in size and in duration.
That does have me a little cautious, but I have a hard time being bearish as long as the ES is above 3920 — and thus, above the 50-day, 10-week and 10-day moving averages.
That puts it above short- and intermediate-term trends, and while I do believe it needs to rest, the 4085 to 4100 level is in play. That’s provided that the ES can stay above 3920 and can eventually get above and stay above 4000.
A Trade on the S&P 500 Futures
This may be a little repetitive, but I’m going to watch a similar setup in the ES as yesterday.
Notice how many times the ES tested 3980 overnight and it held each time. Just below that level — near 3975 — is the 10-ema. This is all on a 4H chart.
If the ES trades down to this area and holds 3975 to 3980, I am going to be long and looking for a push back up toward 4000.
S&P 500 — SPY
The SPY did exactly what we asked by going daily-up over Wednesday’s high. Now the upside is pretty clear: $400 to the gap-fill at $401.44. That’s the next short-term objective.
On the downside, it’s kind of far off at the moment, but the SPY needs to hold $390 to $391.
Nasdaq — NQ
Keeping it simple on the NQ: 12,800 then 13K if the upside momentum continues.
12,150 to 12,250 needs to hold as support on the downside.
GOOGL
Google is trading right near yesterday’s low of $111.11 due to that poor earnings number out of Snap.
If this stock opens below or trades below yesterday’s low early in the session, I will consider a day-trade cash-flow long if it reclaims $111.11 and see if we can’t get a recovery in this name.
This is a lotto-type trade or a cash-flow trade (ie, risking very little to put the trade on, if it triggers).
MSFT
Looking at another big tech name, Microsoft is sitting with a 2x daily-up rotation at $264.89. If we get it, I will consider a lotto trade in this name.
Again, miniscule size because it’s a lotto and these rotation trades can be tough in bear markets.
Go-To Watchlist — Individual Stocks
*Feel free to build your own trades off these relative strength leaders*
Numbered are the ones I’m watching most closely.
Bold are the trades with recent updates.
Italics show means the trade is closed.
Trade Sheets: Down to 2 individual holdings against B/E or profitable stops. Good position to be in.
MCK — We have hit two trim zones so far on MCK. Feel free to cash the last ⅓ of the position as you see fit. $335 to $340 is a potential upside target (and has since been hit).
Moving stop-loss up to $315 and given the consolidation, I am thinking of holding my last ⅓ for a push to $348 to $350.
DLTR — Down to ⅓ position and looking for $175 to $177 as our final target. Raising stops to the $165 to $166 area.
Relative strength leaders (List is cleaned up and shorter!) →
DLTR
COST
PEP
ABBV
UNH
XLE
VRTX
DG
MCK


Very good analysis .. may I ask what you define as relative strength leaders? relative to SPY to their own industry? could you elaborate on how you select those names on the list? I am looking to build a list with my own watchlist on the names I care about , so I would be interested in the mechanics behind it . With much gratitude .
Thank you so much for the explanation. I really love your work