Dip-Buyers Should Have This Key Level Circled on the Charts
Here's the ideal spot in the S&P this week.
Technical Edge —
NYSE Breadth: 85% Upside Volume (!)
NASDAQ Breadth: 78% Upside Volume
VIX: ~$21
Game Plan: S&P, Nasdaq, Bonds, Dollar
Coming into this week, the falling volume yet rising indices keeps in a “cautious bull” state. Put another way, we’re looking to buy the dips rather than sell the rips or buy the upside rotations.
Keep an eye on BMRN and HWM, which we flagged on Friday, as well as CYTK from a prior update.
From here, the debate is beginning to rage about whether we’ve seen the low and the bulls are back, or if this is simply a vicious bear market rally and we have one (or more) legs left on the downside. I don’t think anyone can say with 100% confidence that either scenario is true, so we’ll just go one level at a time.
I really would like to see a little bit of the hot air come out of the market, if not just to assess how aggressive the dip-buyers are. We have the FOMC on Wednesday, with no rate decision attached to it, then Jackson Hole later this month.
S&P 500 — ES
Thursday’s action was ugly, but Friday’s action was powerful and with it, the market remains in a buy-the-dip state.
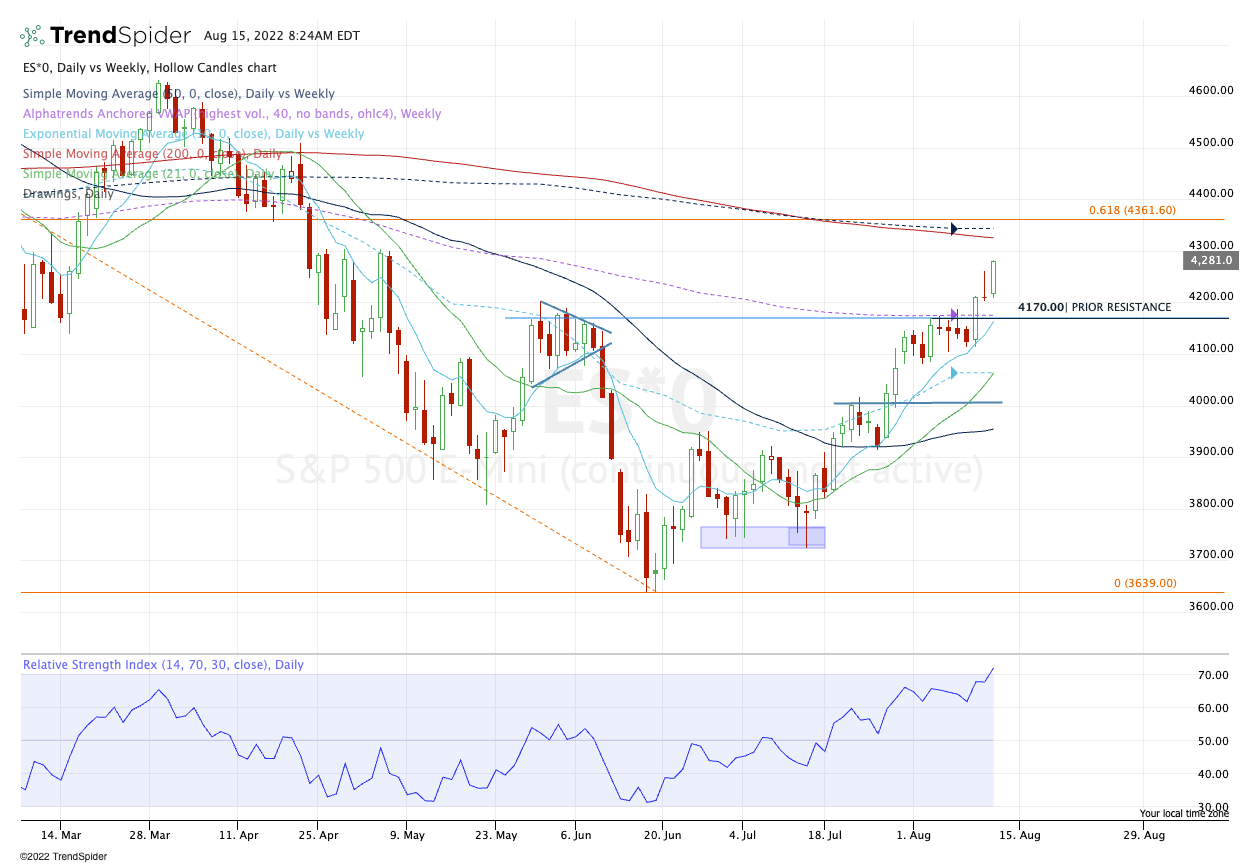
I would love a pullback to 4170-ish in the ES. There we have prior resistance, the rising 10-day moving average (active support) and the weekly VWAP. That’s a great spot for active bulls to step in and buy.
If we continue to push higher, the 61.8% retrace near 4360 is on the table, which comes into play just above the 200-day and 50-week moving averages. This area should be a trouble spot in the short-term for the bulls.
S&P 500 — SPY
Keep reading with a 7-day free trial
Subscribe to Future Blue Chips to keep reading this post and get 7 days of free access to the full post archives.


